What’s Behind the Liftoff in Long-Term Bond Yields?

The recent pronounced upward movements in U.S. Treasury yields at the long end of the yield curve signal that the fundamental drivers affecting Treasury yields have shifted for the first time since 2013.
New Sources of Fundamentals Steering Yields
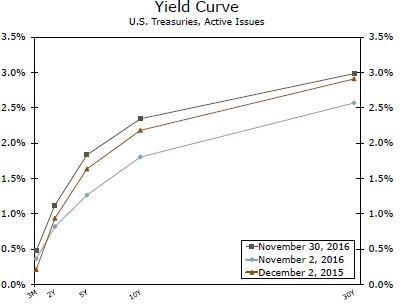
The dominate theme steering U.S. Treasury yields since the taper tantrum in 2013 has been capital inflows in an era of low yields, divergent global monetary policy and low inflation. In the post-election environment, with single party control in the U.S. and an incoming administration intent on expansionary fiscal policy, long-term yields have climbed considerably (top chart). This week we will walk through our expected interaction between fiscal policy actions and their effect on Treasury yields. In response to these market moves, we have adjusted our interest rate forecast.
While the specifics of public policy actions out of the Trump administration are unclear, there are three main themes that emerge based on Presidentelect Trump's campaign promises. First, the desire for more government investment in infrastructure and military spending. Second, the desire for corporate and individual tax reform. Third, the potential for changing trade relationships, perhaps including tariffs on certain imported goods. There are two effects markets have priced-in related to these policies: higher expected inflation and a sizable pick up in net Treasury issuance.
Inflation Expectations Have Drifted Higher
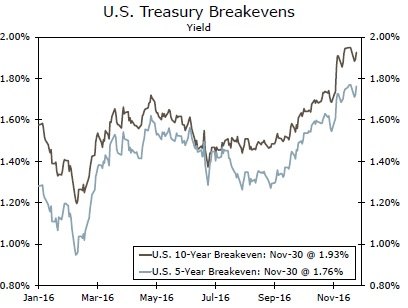
Expectations of greater government spending and higher consumer spending, should tax cuts take place, would likely result in demand-pull inflation, especially given that the economy is close to full employment. Additionally, should barriers to trade increase, the result would likely be higher prices for imported goods which would eventually flow through to consumer and producer prices. Looking at Treasury Inflation-Protected Securities (TIPS) yields, it has become clear that, on net, markets have priced in the likelihood of higher inflation. The 10-year breakeven has climbed about 19 basis points since November 8 (middle chart).
Federal Deficit Projections Key to Near-Term Rate Moves
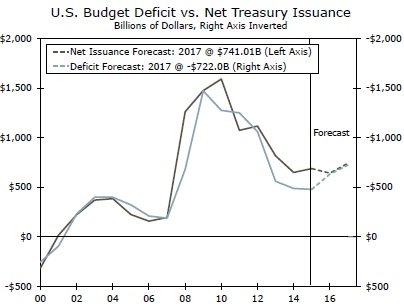
Since 2009, annual federal budget deficits have been declining, resulting in a downshift in net Treasury issuance (bottom chart). Federal fiscal year 2016, which just ended in September of this year, saw a rise in the annual budget deficit relative to the size of the economy, reversing the trend since 2009. Now with the expectation of tax cuts and greater federal spending in the new administration we, and markets, are expecting net Treasury issuance to rise in-step with much larger federal budget deficits in the years ahead. While we certainly do not expect all of Trump's plans to clear Congress, his policy proposals have been estimated to add between $2.6 trillion and $5.3 trillion in additional federal debt over the next 10 years.* Over the near-term, the fiscal policy changes enacted and the resulting inflation expectations and net Treasury issuance projections will become the dominant factors influencing the longer end of the yield curve.
Author

Wells Fargo Research Team
Wells Fargo


