What to Make of the huge difference between ISM and Markit?

ISM and Markit do monthly business surveys that measure the strength of the economy. Both are diffusion indexes where readings above 50 show expansion and below 50 show contraction.
Nearly every month there is a huge difference between the reports.
ISM Services
ISM recently made a name change. Their index used to be called the non-manufacturing Index (NMI). It is now more aptly named as ISM Services.
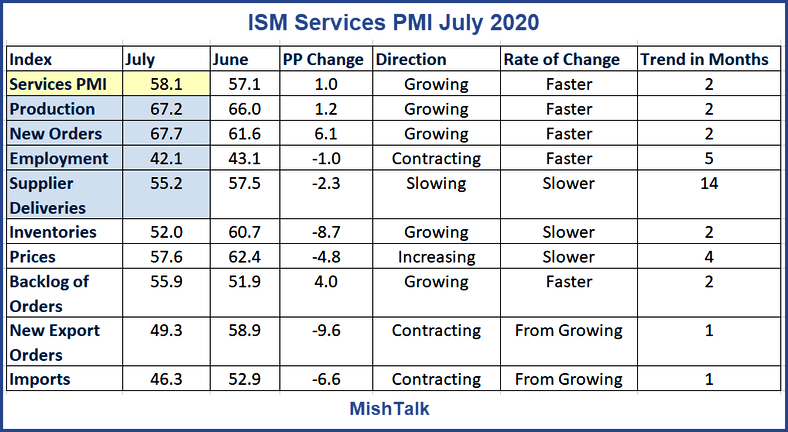
In July, the Services PMI™ registered 58.1 percent, 1 percentage point higher than June’s figure of 57.1 percent. The reading indicates the services sector grew for the second consecutive month after two months of contraction and 122 months of growth before that. A reading above 50 percent indicates the services sector economy is generally expanding; below 50 percent indicates the services sector is generally contracting.
The Services PMI is an average of Production, New Orders, Employment, and Supplier Deliveries.
New Orders
ISM’s New Orders Index registered 67.7 percent, an increase of 6.1 percentage points from the June reading of 61.6 percent. New orders grew for the second consecutive month after two months of contraction and a preceding period of 128 consecutive months of expansion. Comments from respondents include: “Resumption of elective surgery activity” and “A surge in new orders due to openings of businesses.”
The 12 industries reporting growth of new orders in July — listed in order — are: Retail Trade; Health Care & Social Assistance; Wholesale Trade; Arts, Entertainment & Recreation; Educational Services; Real Estate, Rental & Leasing; Public Administration; Construction; Management of Companies & Support Services; Transportation & Warehousing; Finance & Insurance; and Utilities. The two industries reporting contraction in July are: Mining; and Professional, Scientific & Technical Services.
Employment
Employment activity in the services sector contracted in July for the fifth month in a row following 72 consecutive months of growth. ISM’s Services Employment Index registered 42.1 percent, down 1 percentage point from the June reading of 43.1 percent. Comments from respondents include: “Current freeze on all open positions” and “Lower due to retirements and departures; limited new hiring at this time.”
The five industries reporting an increase in employment in July are: Arts, Entertainment & Recreation; Agriculture, Forestry, Fishing & Hunting; Retail Trade; Health Care & Social Assistance; and Utilities. The 13 industries that reported a reduction in employment in July — listed in order — are: Real Estate, Rental & Leasing; Educational Services; Management of Companies & Support Services; Other Services; Accommodation & Food Services; Transportation & Warehousing; Mining; Professional, Scientific & Technical Services; Information; Wholesale Trade; Public Administration; Construction; and Finance & Insurance.
ISM New Orders are Up, Employment Down
New orders are way up but industries are not hiring.
Let's check in with Markit.
IHS Markit U.S. Services PMI
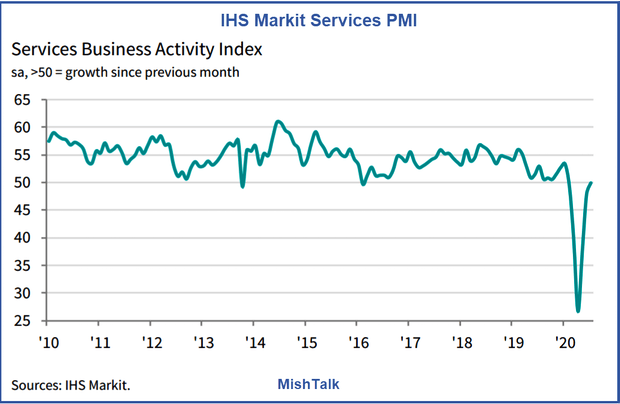
The seasonally adjusted final IHS Markit US Services PMI Business Activity Index registered 50.0 at the start of the third quarter, up from 47.9 in June and improving on the 'flash' estimate of 49.6, to signal a stabilization in service sector business activity.
In contrast, new business continued to decrease in July. Service providers registered a marginal rate of decline which was slightly greater than seen in June. The drop in new order inflows was often linked to customer hesitancy and social distancing measures stemming from the COVID-19 pandemic.
Service providers recorded the first increase in employment since February in July, as pressure on capacity due to COVID-19 restrictions on business processes causing delays to the handling of order books. Although only marginal, the expansion in payroll numbers signalled a turnaround from the marked contractions seen in April and May. Backlogs of work rose marginally, but at the fastest pace for a year.
Markit New Orders are Down, Employment Up
Markit is the opposite ISM on New Orders and Employment.
Purportedly, both measure US service activity.
Econoday provides this comparison.
ISM vs Markit Survey Methodology
- ISM: The Institute For Supply Management surveys more than 375 firms from numerous sectors across the United States for its non-manufacturing index. This index covers services, construction, mining, agriculture, forestry, and fishing and hunting. The non-manufacturing composite index has four equally weighted components: business activity (closely related to a production index), new orders, employment, and supplier deliveries (also known as vendor performance). The first three components are seasonally adjusted but the supplier deliveries index does not have statistically significant seasonality and is not adjusted.
- Markit: US Services Purchasing Managers' Index (PMI) is based on monthly questionnaire surveys collected from over 400 U.S. companies which provide a leading indication of what is happening in the private sector services economy. It is seasonally adjusted and is calculated from seven components, including New Business, Employment and Business Expectations.
Industry Weighting
For there to be this radical of a difference suggests one or both of these companies have a severe industry weighting problem.
Survival Bias
Companies that go out of business do not respond. And with Covid, businesses may have better things to do with their time than answer surveys.
Finally, those companies with good things to say may be more inclined to respond that companies firing employees or about to go out of business.
It would help to have monthly comments like these:
- We surveyed X number of companies but only Y% elected to answer.
- This is our current industry weighting ...
Diffusion Indexes
With diffusion indexes, a company hiring one employee counts as much as another firing 300 or even 3,000. Factor in a small sample size and the ability of companies to not waste time responding to surveys and the reports might look like (and do look like) complete nonsense.
Responding to these reports is voluntary. I also wonder if companies with negative hiring or outsourcing are reluctant to admit that for fear of incurring the wrath of Trump.
Regardless, something is seriously wrong with ISM reports compared to actual production numbers.
Economically speaking, the commentary from Markit makes more sense than the wild divergences between orders and hiring in the ISM survey.
Guess which one the Fed and economic models pay attention to.
Author

Mike “Mish” Shedlock's
Sitka Pacific Capital Management,Llc


