What inflation data would it take for the Fed to be seen as retreating from the two-cut narrative?

In response to the Trump sanctions on Russian oil companies, former Russian President Dmitry Medvedev said the latest Trump moves over Ukraine are "an act of war against Russia." He is not a sitting government official and his judgment is not official, but he’s not wrong if we add the word “economic” to war.
The EU has been cutting back on Russian energy supply some 19 times and the UK did more yesterday, too. Trump has no aptitude for forming alliances but now the US has acted, an alliance against Russia is coming together, if haphazardly. So, this has the potential to be a historic big deal. It has yet to play out but has some small chance of being the beginning of the end of the Russian invasion of Ukraine.
Today the data feed includes Sept existing home sales, the Kansas City Fed business survey for Oct, an EU summit in Brussels, and more earnings of US companies (Intel) after several disappointments recently (Tesla, Nvidia).
On the data front, tomorrow could be a flashpoint for shifting the economic perspective—we get the US Sept CPI.
As reported yesterday, Goldman Sachs earlier in the month had estimated that regular consumers will pay more than half of the cost of tariffs. US companies will pay 22%, exporters will pay 18% and 5% will be evaded. Another report from the St. Louis Fed indicated “The purchasing power of $1,000 today would be reduced to $820 in 10 years time under a steady 2% annual inflation scenario. It falls to $744 in a 3% regime.”
Ah, note that qualifier, “ten years.” The Fed doesn’t look ten years out. It looks out 3-6-9-12 months. None of these dire warnings about looming inflation have nudged the rate cut bettors an inch. The next FOMC meeting is only 6 days away. As of yesterday morning, the CME FedWatch tool has a 96.3% probability of two rate cuts by the Dec 10 FOMC.
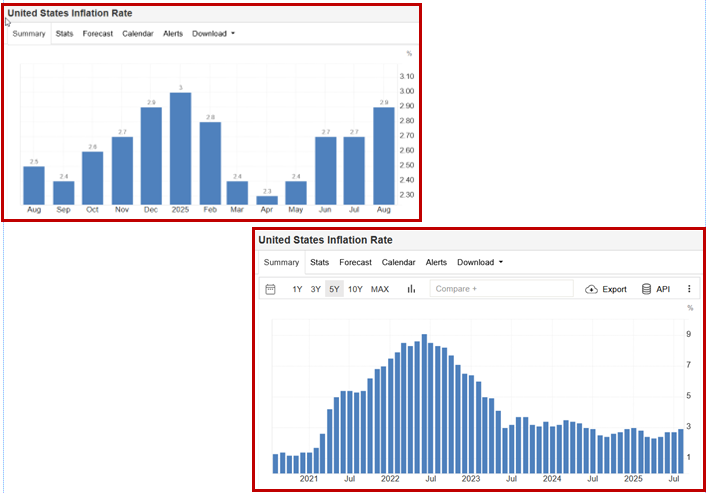
What inflation data would it take for the Fed to be seen as retreating from the two-cut narrative? See the Trading Economics charts. The one on the left is the one-year. The chart on the right is the 5-year. When you add 3.1% expected from 2.9% in Aug to the 5-year, it’s not so bad. So, what is the right perspective? By the way, Trading Economics forecasts “only” 3%, not the consensus 3.1%.
Bottom line, CPI would have to be far bigger than expected to affect the Fed at all. Two cuts it is.
Forecast: We have to assume the two Fed rates are already fully priced in. Therefore, the appearance of a new factor—oil prices and deepening trade war with the buyers of Russian oil, India and China—means risk-off. Flight to safe havens “should” be the response, implying a dollar upswing continuation. It’s interesting that the dollar rise against the other big safe haven, the Swiss franc, is faltering.
Realistically, sanctions are very hard to enforce. Russia can stagger along for some longish time before there is a resolution. Something else has to be added to sanctions to affect the Ukraine war—maybe those missiles. Bullying China is well-nigh impossible but Trump may get India.
It’s kind of fun that shiny gold is recovering on the black gold story. But don’t get too excited just yet. A return to newer higher highs is a ways off, judging from history. Still, safe haven.
Trump is famously anti-war. Don’t buy the idea that a real boots-on-the-ground war with Russia is pending. It’s not. Trump will back down first. However, the ball is now in Putin’s court. Fear is the correct response.
Tidbit: Remember we will get a revised Atlanta Fed GDPNow on Monday, Oct 27. The last one (Oct 17) had Q3 at 3.9%. This robustness has been the primary justification for dollar -buying, even if usually a strong GDP suggests no rate cuts, while this time we expect two. Go figure.
This is an excerpt from “The Rockefeller Morning Briefing,” which is far larger (about 10 pages). The Briefing has been published every day for over 25 years and represents experienced analysis and insight. The report offers deep background and is not intended to guide FX trading. Rockefeller produces other reports (in spot and futures) for trading purposes.
To get a two-week trial of the full reports plus traders advice for only $3.95. Click here!
Author

Barbara Rockefeller
Rockefeller Treasury Services, Inc.
Experience Before founding Rockefeller Treasury, Barbara worked at Citibank and other banks as a risk manager, new product developer (Cititrend), FX trader, advisor and loan officer. Miss Rockefeller is engaged to perform FX-relat


