What events in Saudi Arabia mean for markets

Having been fixated by slowing demand this summer, financial markets now have to deal with the supply side – what does the attack on Saudi facilities mean for the global economy? Unless production is quickly restored, the disruption looks set to add to recessionary fears, keeping yield curves flat and, barring a dovish surprise from the Fed, the dollar bid
The Saudi outage: who is most exposed?
As our commodities team have outlined, one of the most pressing issues from the Saudi Aramco facilities attack is how quickly Saudi production facilities can resume production.
A couple of metrics being discussed are: i) Saudi oil inventories are probably less than 26 days’ worth of Saudi oil exports and ii) extra supply from OPEC + (perhaps worth 800-900 thousand barrels per day (bpd) won't be anywhere near sufficient to compensate for the over 5m bpd Saudi outage. A prolonged outage would therefore likely see Brent crude trading well over $70 and perhaps closer to $80 if the outage extended over three to four weeks.
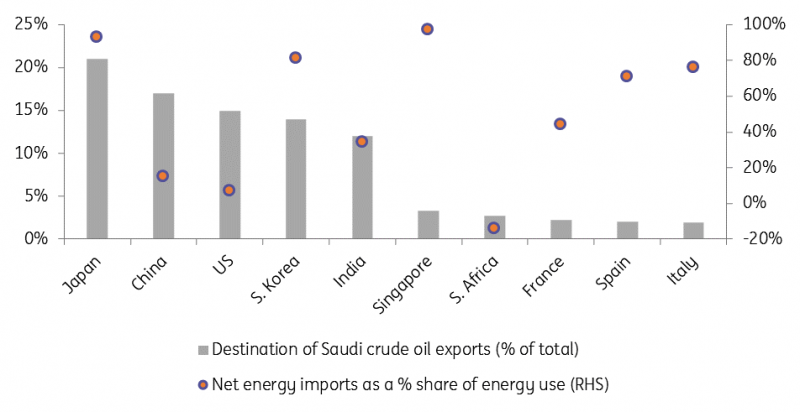
In terms of those countries most impacted by the loss of Saudi exports, the chart below shows the top ten destinations for Saudi crude oil. We’ve overlaid this chart with an energy dependency ratio – a ratio outlining what share of domestic energy use derives from net energy imports. This latter data series is a little out-dated (using 2015 data in many cases) and the US is far closer to energy independence than the 7% reading this chart suggests.
Most affected, it would seem, are countries like Japan, Korea and India - big buyers of Saudi oil plus high energy dependency ratios. However, the US is now close to energy independence and should be less affected. Again it would seem that Asia is most affected by this supply disruption, effectively compounding the challenges posed by the US-China trade war and the semi-conductor cycle.
Can the market manage with this lost supply?
Destination of Saudi crude exports
G10 FX markets react predictably
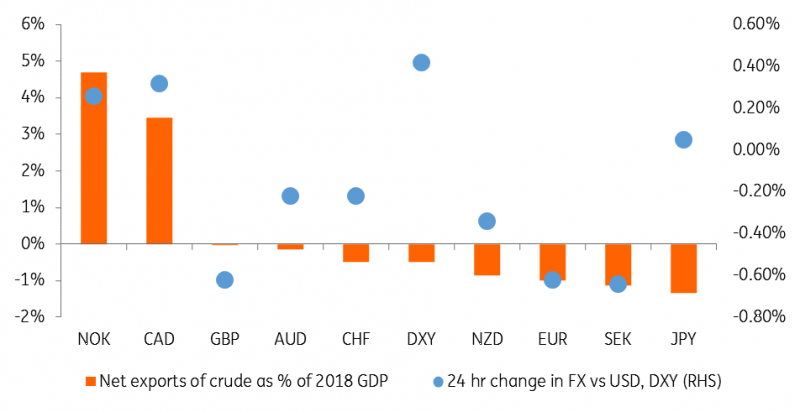
FX markets have reacted in predictable fashion. In the G10 space, the oil exporters of CAD and NOK have clearly out-performed in the first 24 hours of trading since the attack, plus some safe-haven demand for both the USD and the JPY. European activity currencies have once again under-performed, with the prospects of higher energy costs adding to the already weak outlook for industrial production. Unless the Fed turns exceptionally dovish, worried that an oil shock undermines the key source of US growth – consumption – then it looks like the dollar can stay relatively bid and EUR/USD sinks into a 1.05-1.10 range into year-end.
Net crude export position drive early G10 FX trends
Emerging market FX: Crude rally may help RUB via macro-stability
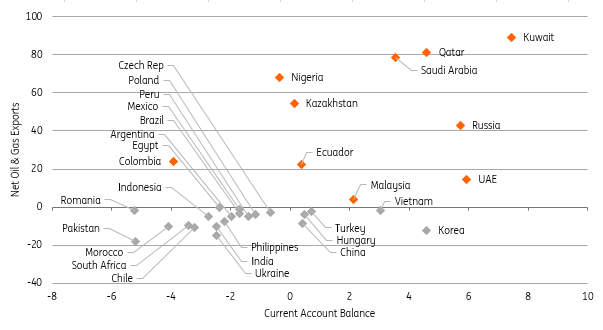
In the EMFX space, so far the Korean won has bucked the oil trend as outlined above, but the Indian rupee has understandably come under pressure, with higher energy costs adding to further concerns over India's twin deficits.
The rouble is performing well and our Russian Chief Economist believes the spike in oil may have a short-term positive impact on the RUB, but it’s worth remembering that in Russia there is a fiscal rule, which essentially forces the economy and markets to perform as if Urals is fixed at $41.6/bbl+2% p.a, making RUB less of a commodity currency and more of an EM story.
That said the higher oil price further improves the perception of Russia’s macro stability, potentially supportive for portfolio inflows into the local state bonds (OFZ), but it’s unclear how the general EM risk perception changes if Middle East tensions escalate. For now, we maintain our USD/RUB forecast of 63-67/$ into year-end, while acknowledging some upside risks.
EMFX: Looking at the net energy versus current account balance trade-off
How will the rates market react?
Fundamentally we would expect the impact of a sustained increase in oil prices to be negative for real growth, and so to tend to depress real rates in developed markets. The reality, as always, is more complicated and it is worth looking into the factors that would make the oil spike translate into a central bank reaction.
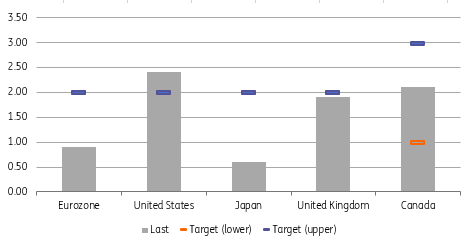
If we can generalise, most central banks would be inclined to ‘look through’ any temporary spike in inflation on account of the high volatility in energy price. As such, most of them make at least indirect reference to core inflation, typically stripped of its most volatile components such as food and energy. This is the reason why we think that on balance, central banks are more likely to respond to the potential growth (negative) shock than inflation (positive) shock.
An exception to this rule of thumb is when central banks have a more explicit inflation mandate that could trigger them to ‘disregard’ a temporary growth shock if it does not bring about a reduction in inflation further down the line. There are a number of reasons why this could be the case, for instance depending on the persistence of the rise in price.
Another reason can be that the economy is operating close to full capacity and/or that inflation is already at or above target. In this instance, a further increase in oil price would risk a rise in inflation expectations beyond what a central bank is willing to countenance. Using this metric as an indicator to compare various developed markets, it seems that the US is both the country where higher oil prices are likely to be reflected in headline inflation (since the US has one of the lowest tax wedges on gasoline), and where the central bank has the least room for manoeuvre when it comes to ignoring any spike.
Applying the above into the current economic context, growth expectations are already depressed in a number of developed economies and the focus has been squarely on how much accommodation can be delivered.
With this in mind, we expect investors could view a prolonged increase in oil price as a threat to Fed easing. Indeed, this would make the risk, highlighted by our chief US economist, of a less dovish tone at this week’s meeting more prevalent. This may result in higher rates in the US compared to other currency zones and in a flattening of the USD curve.
Core inflation versus CB targets in developed markets
A prolonged disruption to Saudi oil exports could add pressure to those countries already exposed to the manufacturing slow-down. Recessionary fears, flat yield curves and a strong dollar look set to remain in play.
Read the original article: What events in Saudi Arabia mean for markets
Author

Chris Turner
ING Economic and Financial Analysis
Chris is Head of FX Strategy at ING. Together with his team, he provides short and medium-term FX recommendations for ING’s corporate and institutional client base.


