Weekly Waves: EUR/USD, US30 and Bitcoin
-
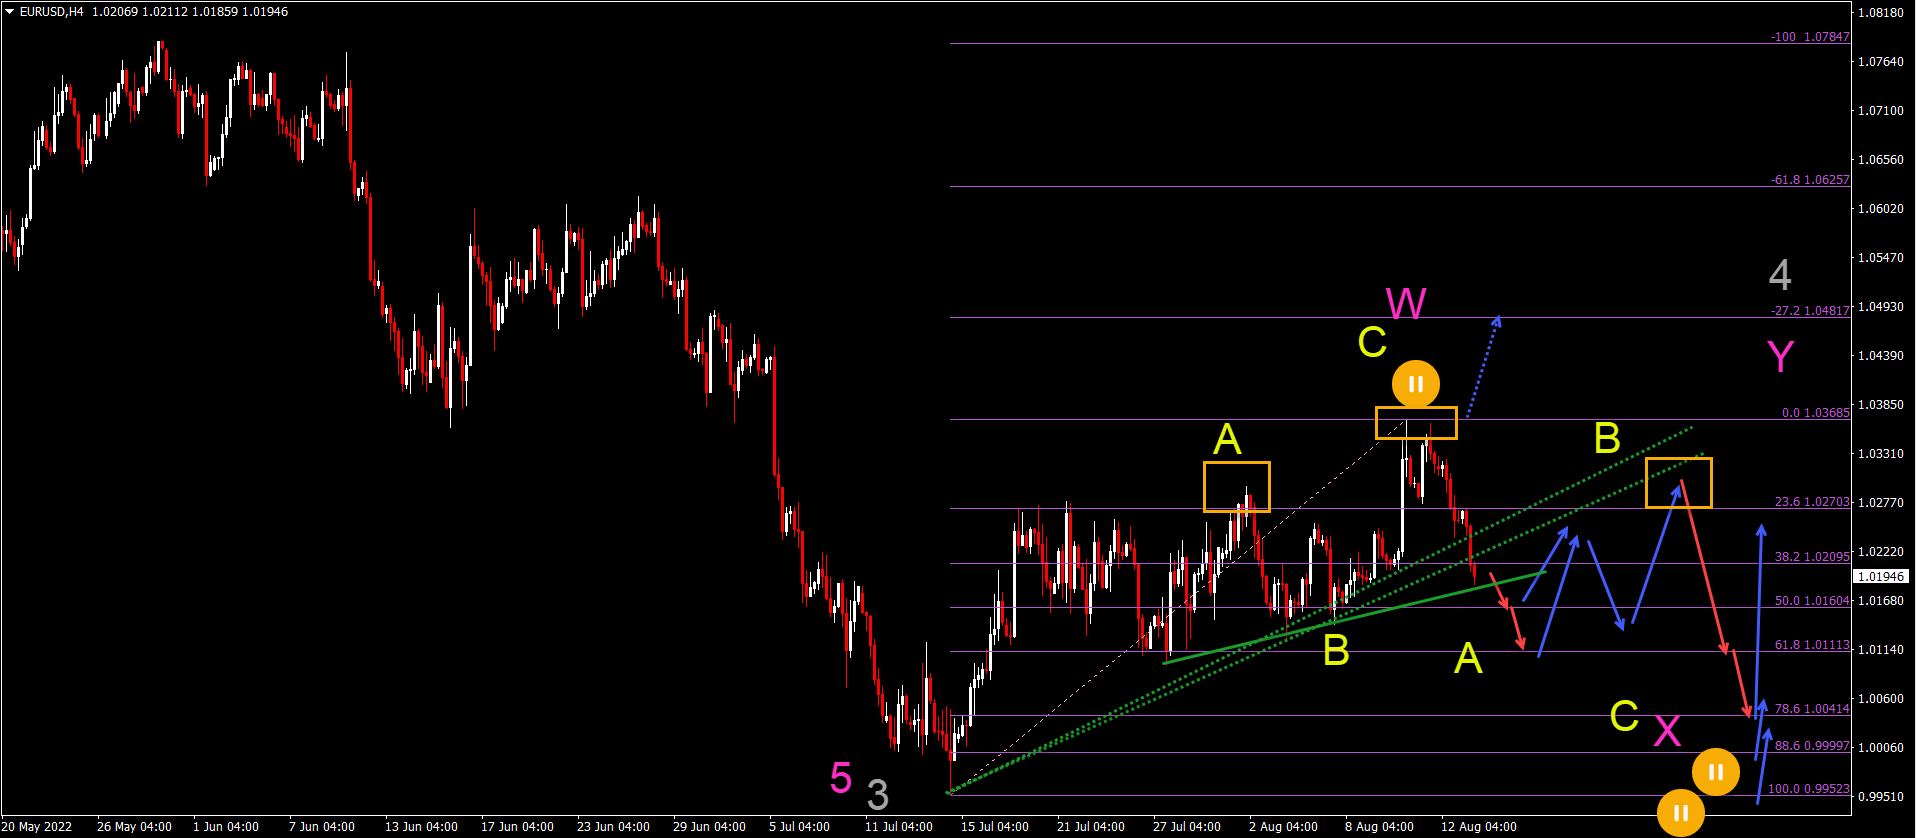
The EUR/USD is showing a strong bearish decline at the moment. Let’s review the Elliott Wave patterns to understand why price action made such a strong reversal.
-
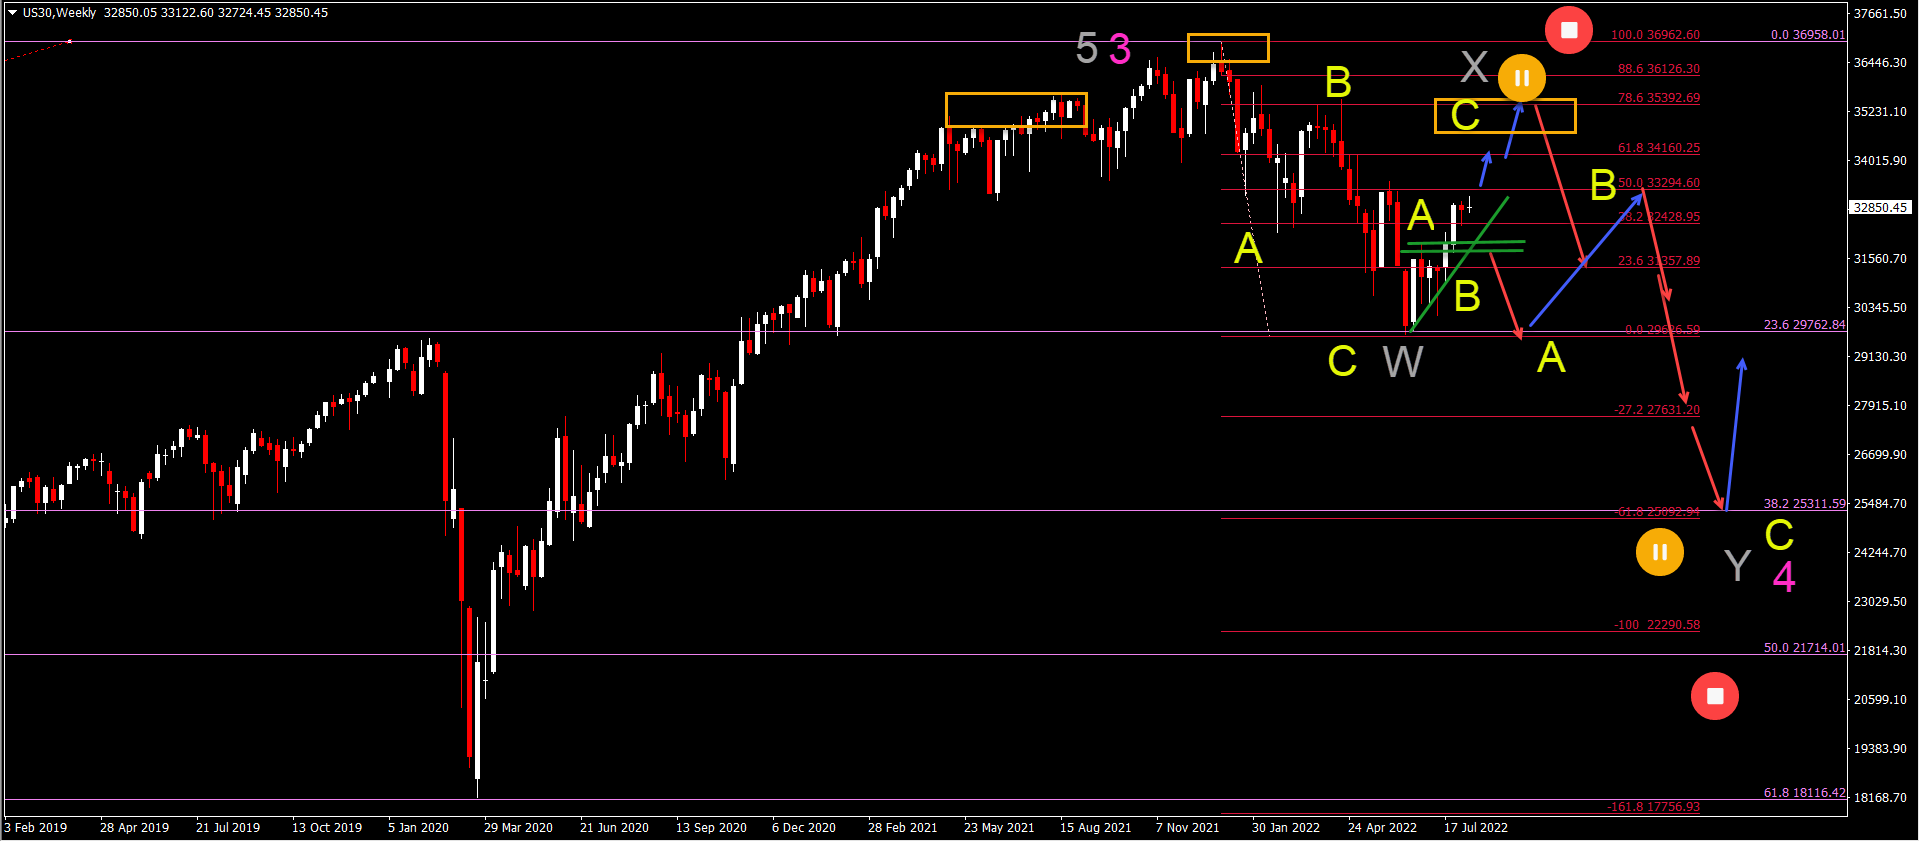
The US30 weekly chart is showing bullish price action but the rally looks like a rise before yet another decline.
-
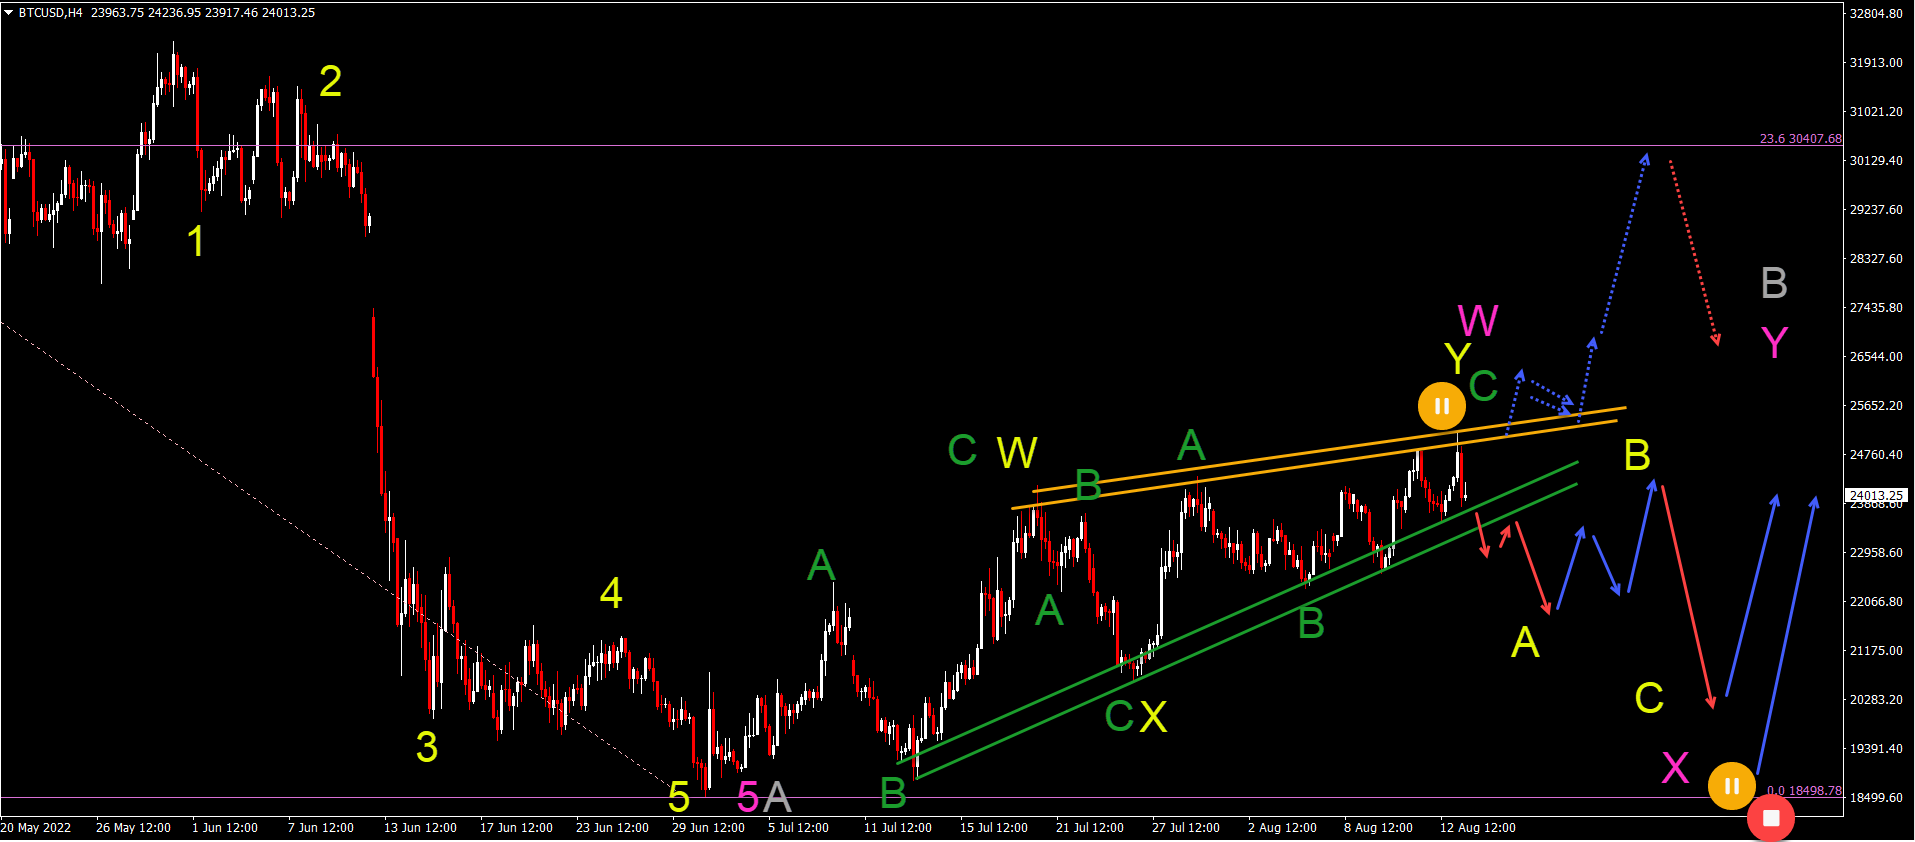
BTC/USD rising wedge is indicating the end of the bullish rally, unless price action manages to break above the resistance trend lines (orange).

Our weekly Elliott Wave analysis reviews the EUR/USD 4 hour chart, the US30 (DJI) weekly chart, and the Bitcoin cryptocurrency 4 hour chart.
EUR/USD bearish ABC in larger bullish correction
-
The EUR/USD bullish price action was labeled as a bullish correction so the choppy and weak uptrend is what we expected.
-
The bullish price action seems to have completed an ABC (yellow) pattern.
-
The bullish correction, however, could still be alive because we believe that a larger WXY (pink) is taking place in wave 4 (gray).
-
Non-technical reasons to expect a longer correction include the fact that August is usually a choppy month, the slight pause in inflation (from month to month perspective), and decrease of the year on year inflation rate last month.
-
Therefore we now expect a wave X (pink). To confirm this Elliott Wave pattern, we should see an ABC (yellow) wave within wave X (pink).
-
A bullish bounce could take place at the 50% or 61.8% Fibonacci retracement level.
-
The bullish bounce could take price up to the head and shoulders level (orange boxes).
-
A bearish bounce at the resistance could see price decline to challenge the deeper Fibonacci support levels and most likely, we should see a bullish reversal at those support zones.
US30 rally expected to reverse at resistance
-
The US30 chart could have some space for a small rally.
-
Although price action has reached the 50% Fibonacci level, price action could rise as high as the head and shoulders level (orange boxes).
-
A bearish bounce is expected at this resistance zone. A break above it would probably change the bearish perspective.
-
A bearish breakout (red arrows) below the support (green lines) could indicate that the rally is finished.
-
A larger bullish ABC (yellow) pattern should complete wave X (gray).
-
A bearish ABC (yellow) should then take price action down to the 38.2% Fibonacci retracement level of a larger wave 4 (gray).
-
A larger complex correction could emerge so that wave Y (gray) completes a larger wave X of the wave 4.
-
Eventually, once the bearish correction completes waves 4 (pink), a new uptrend could emerge in wave 5 as long as price action remains above the 50%.
-
A break below the 38.2% and especially the 50% Fibonacci retracement level indicates a strong downtrend.
BTC/USD should rally after ABC down
Bitcoin (BTC/USD) is building a rising wedge reversal pattern:
-
A bullish breakout would in that case start a potential rally (dotted blue arrows) towards 23.6% Fibonacci retracement level.
-
A breakout below the support lines (green) could start a bearish correction lower (red arrows).
-
A larger ABC (green) pattern has probably completed wave Y (yellow) of wave W (pink).
-
Now an ABC (yellow) is expected to unfold in wave X (pink).
-
Once the wave X (pink) is completed, a new bullish rally should take price up again within wave Y (pink) of wave B (gray).
The analysis has been done with the indicators and template from the SWAT method simple wave analysis and trading. For more daily technical and wave analysis and updates, sign-up to our newsletter
Author

Chris Svorcik
FS method
Chris Svorcik is a trader, analyst, and educator with over 15 years of experience in financial markets, specializing in moving averages, market structure, and price patterns.


