Weekly Waves: EUR/USD, GBP/USD and natural gas
-
NGas has made a steep decline below the $7 but the the speed of the downtrend is slowing down
-
Our weekly Elliott Wave analysis reviews the EUR/USD daily chart, the GBP/USD weekly chart, and the NGas 4 hour chart.
-
The EUR/USD made a massive bearish drop from about 1.02 to 0.95 in a matter of days but the bullish rebound took the shape of a V-valley reversal
-
The GBP/USD made a 2,000 pip decline, which was then followed by a strong 1,000 pip rally. Certainly the GBP does not lack volatility.

EUR/USD elastic drop encounters rapid bullish V-Valley
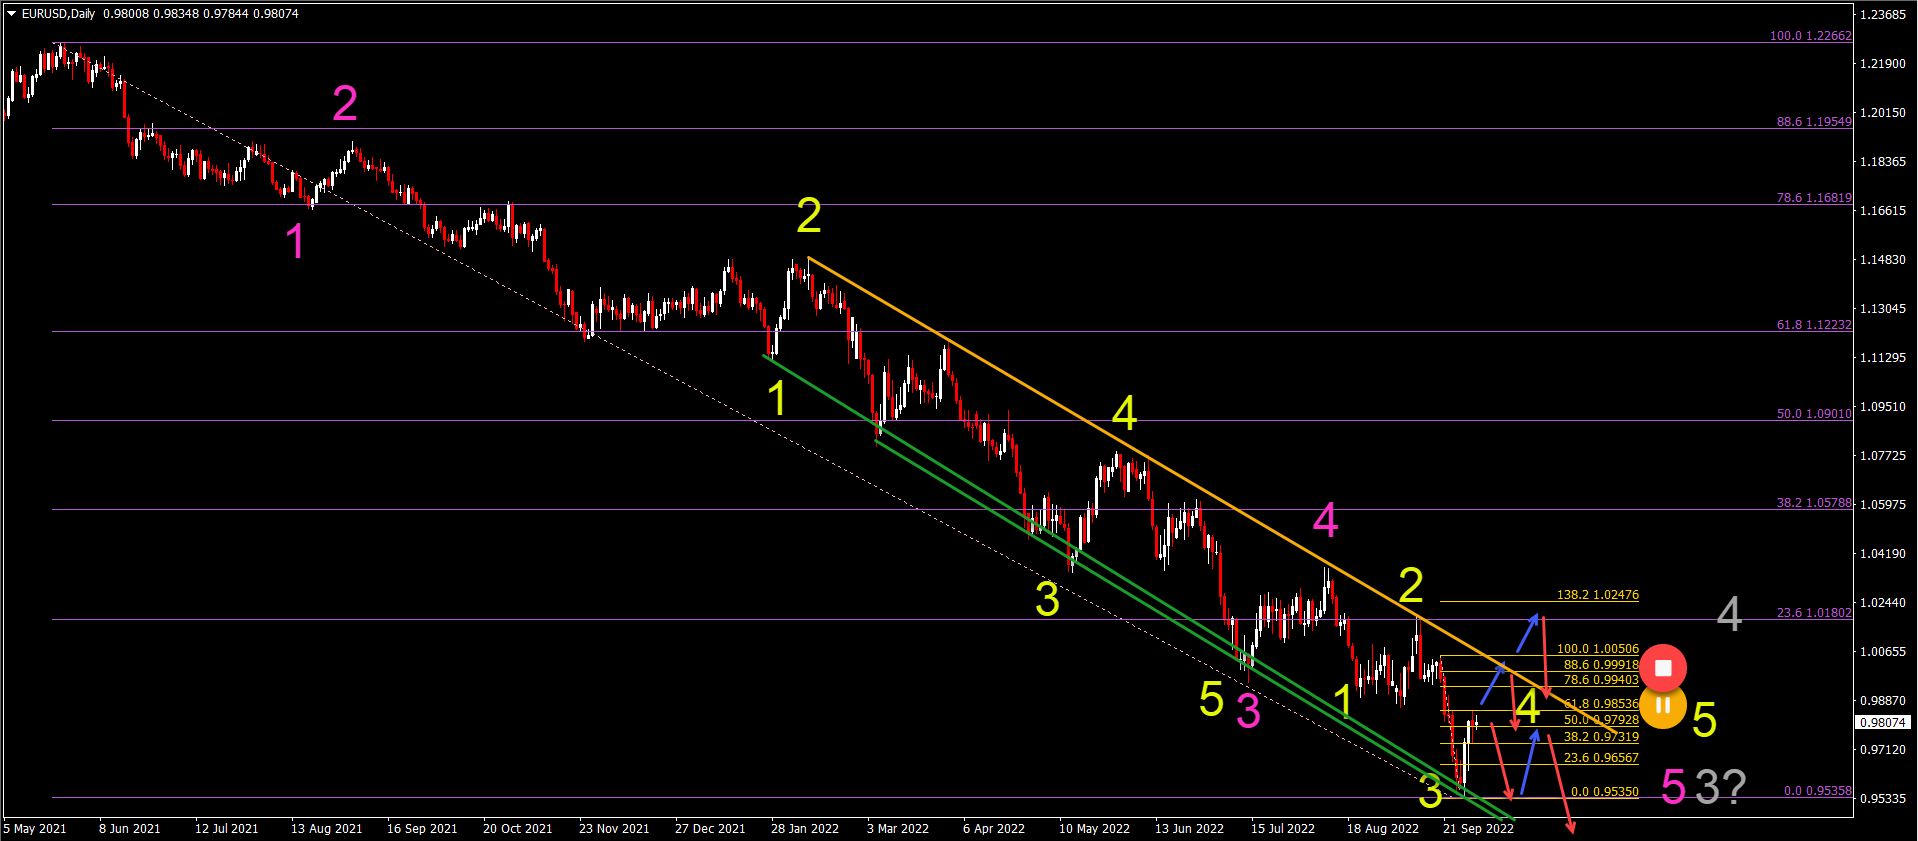
The EUR/USD made a massive bearish drop from about 1.02 to 0.95 in a matter of days but the bullish rebound took the shape of a V-valley reversal:
-
The EUR/USD downtrend channel is well established and price action used the support (green) and 0.95 round level for a bounce back up.
-
Price action is at a crossroad, where it could use the local Fibonacci resistance levels for a bounce within wave 4 (yellow).
-
A bullish ABC pattern could unfold in wave 4 (yellow) before another drop within the downtrend.
-
Or price action could break above the Fibonacci levels and challenge again the resistance line (orange) of the downtrend channel and perhaps the 23.6% Fibonacci level of the larger wave 4 (gray).
-
When a trend is so extended as the current downtrend, it is always difficult to determine the end of the wave 3 and the start of the wave but a good clue would be 5-7 weekly candles not breaking for a lower low.
GBP/USD 2,000 pip decline followed by 1,000 pip rally
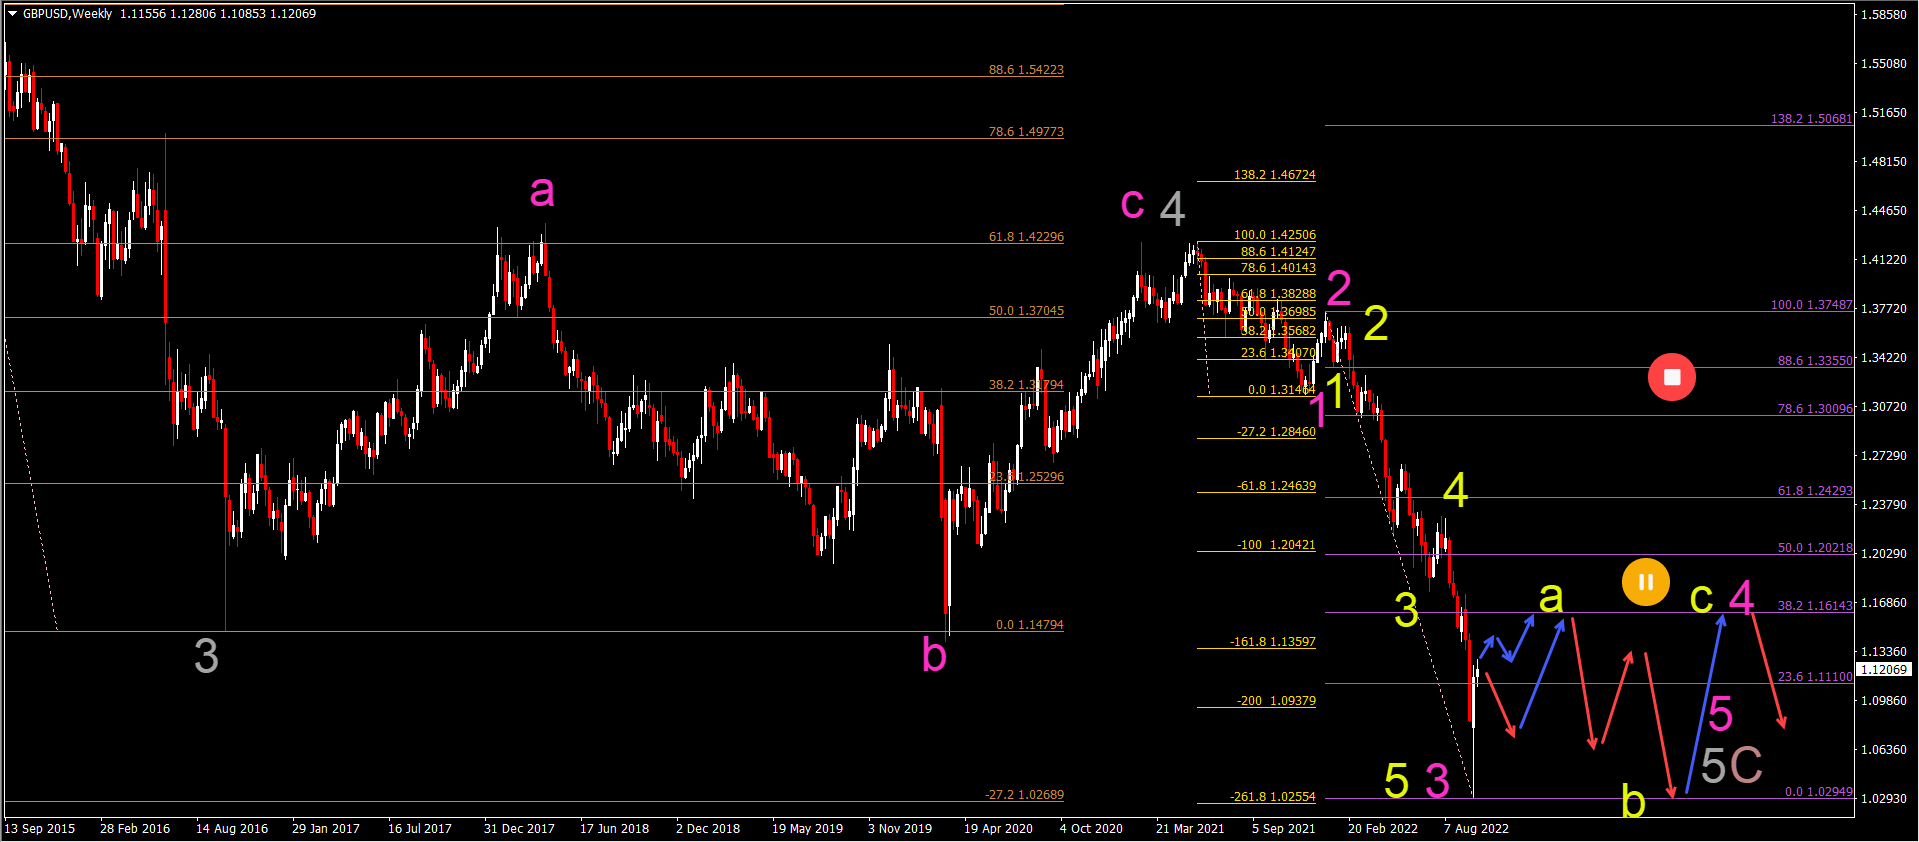
The GBP/USD crashed from 1.2250 towards 1.0250 in a matter of days but the bullish reaction was equally intense:
-
The GBP/USD made a 2,000 pip decline, which was then followed by a strong 1,000 pip rally. Certainly the GBP does not lack volatility.
-
The GBP/USD made a strong bullish bounce at the confluence of support levels. At the 1.0250 support zone there was a -27.2% Fibonacci target (brown) of the wave 5 (gray) and a -261.8% Fibonacci target (orange) of the wave 123 (pink).
-
The strong bullish bounce indicates a high chance that the wave 3 (pink) has been completed and that a wave 4 (pink) has started.
-
A bullish ABC (yellow) pattern is expected to unfold within wave 4 (pink).
-
One more push up towards 38.2% Fibonacci level (purple) at 1.16 is likely (blue arrow).
-
A break above the 50% Fibonacci level could place a serious question mark on this Elliott Wave pattern.
Natural gas downtrend prevails but breakout needed
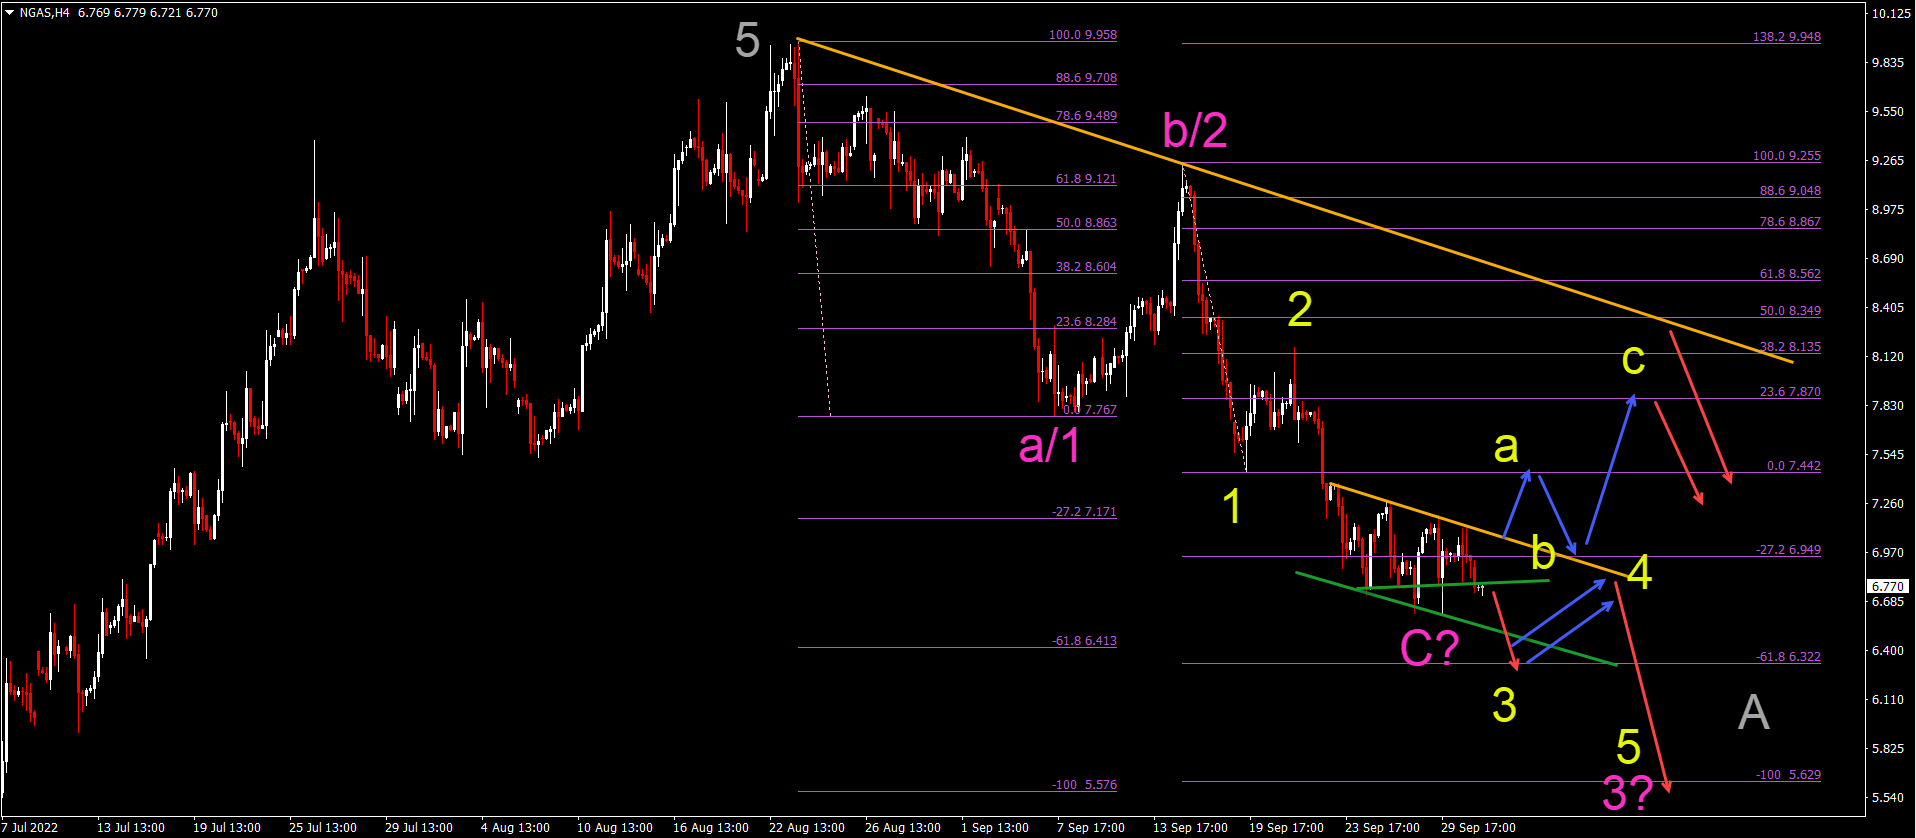
Natural gas has made a steep decline below the $7 but the speed of the downtrend is slowing down:
-
NGas will need to break (red arrow) the support zone (green lines) for a downtrend continuation towards the -61.8% Fibonacci targets.
-
A bear flag pattern followed by another bearish breakout would confirm a potential 5 wave (yellow) pattern within a wave 3 (pink) pattern.
-
A bullish breakout above the downtrend channel (blue arrows) could indicate the end of the bearish ABC (pink) and the start of some type of bullish ABC (yellow).
-
The downtrend target is aiming at the moment for $5.50 to $6.
-
The bullish corrective target would aim for the resistance zone around $7.5-$8.
The analysis has been done with the indicators and template from the SWAT method simple wave analysis and trading. For more daily technical and wave analysis and updates, sign-up to our newsletter
Author

Chris Svorcik
Elite CurrenSea
Experience Chris Svorcik has co-founded Elite CurrenSea in 2014 together with Nenad Kerkez, aka Tarantula FX. Chris is a technical analyst, wave analyst, trader, writer, educator, webinar speaker, and seminar speaker of the financial markets.


