Weekly waves: EUR/USD, GBP/USD and Gold
-
Our weekly Elliott Wave analysis reviews the EUR/USD weekly chart, the GBP/USD 4 hour chart, and the Natural Gas daily chart.
-
The EUR/USD showed a Doji weekly candlestick pattern at the 38.2% Fibonacci retracement level.
-
The GBP/USD is approaching two strong Fibonacci targets and the strong round resistance level of 1.2250-1.25 after a spectacular 2,000 pip rally.
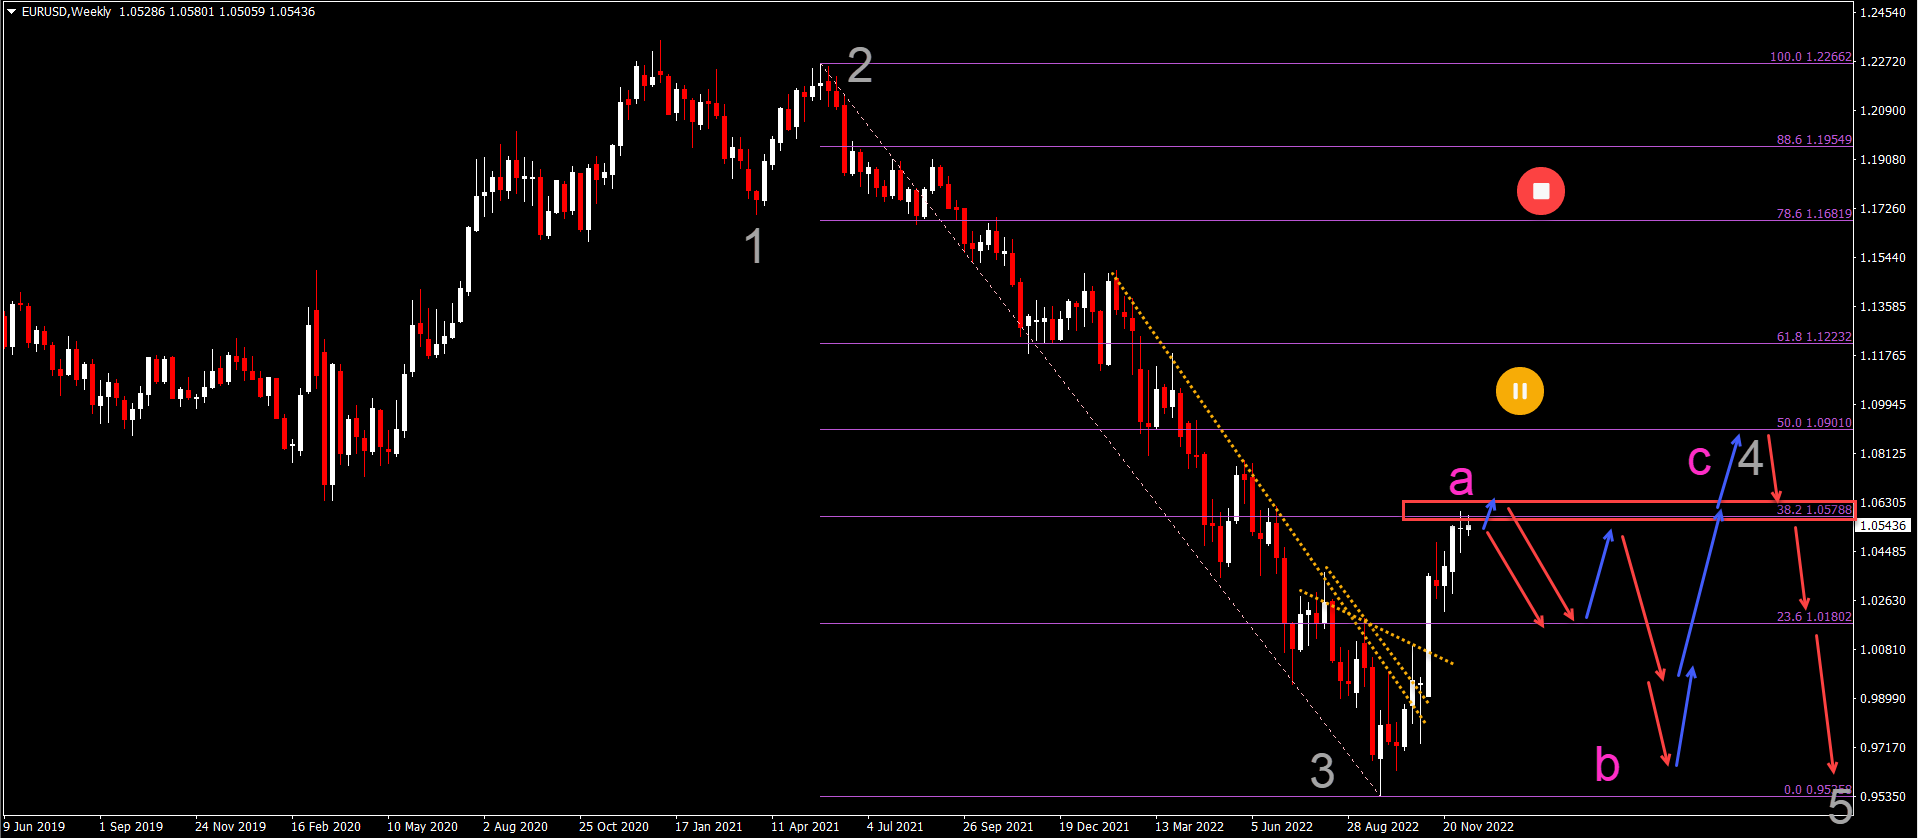
EUR/USD weekly doji candle at 38.2% Fib resistance
-
The EUR/USD weekly Doji indicates indecision at the strong 38.2% Fib resistance.
-
There is also a small rising wedge reversal chart pattern visible on the 4 hour and daily chart.
-
A bearish bounce (red arrows) could confirm the end of a wave A (pink) of wave 4 (gray).
-
A small bullish push up (blue arrow) could still be part of a wave.
-
A (pink) as long as price action stays below 1.0750. A bearish ABC could take place within wave B (pink).
-
The ABC (pink) could complete a wave 4 (gray) after which a new downtrend could emerge in wave 5 (gray).
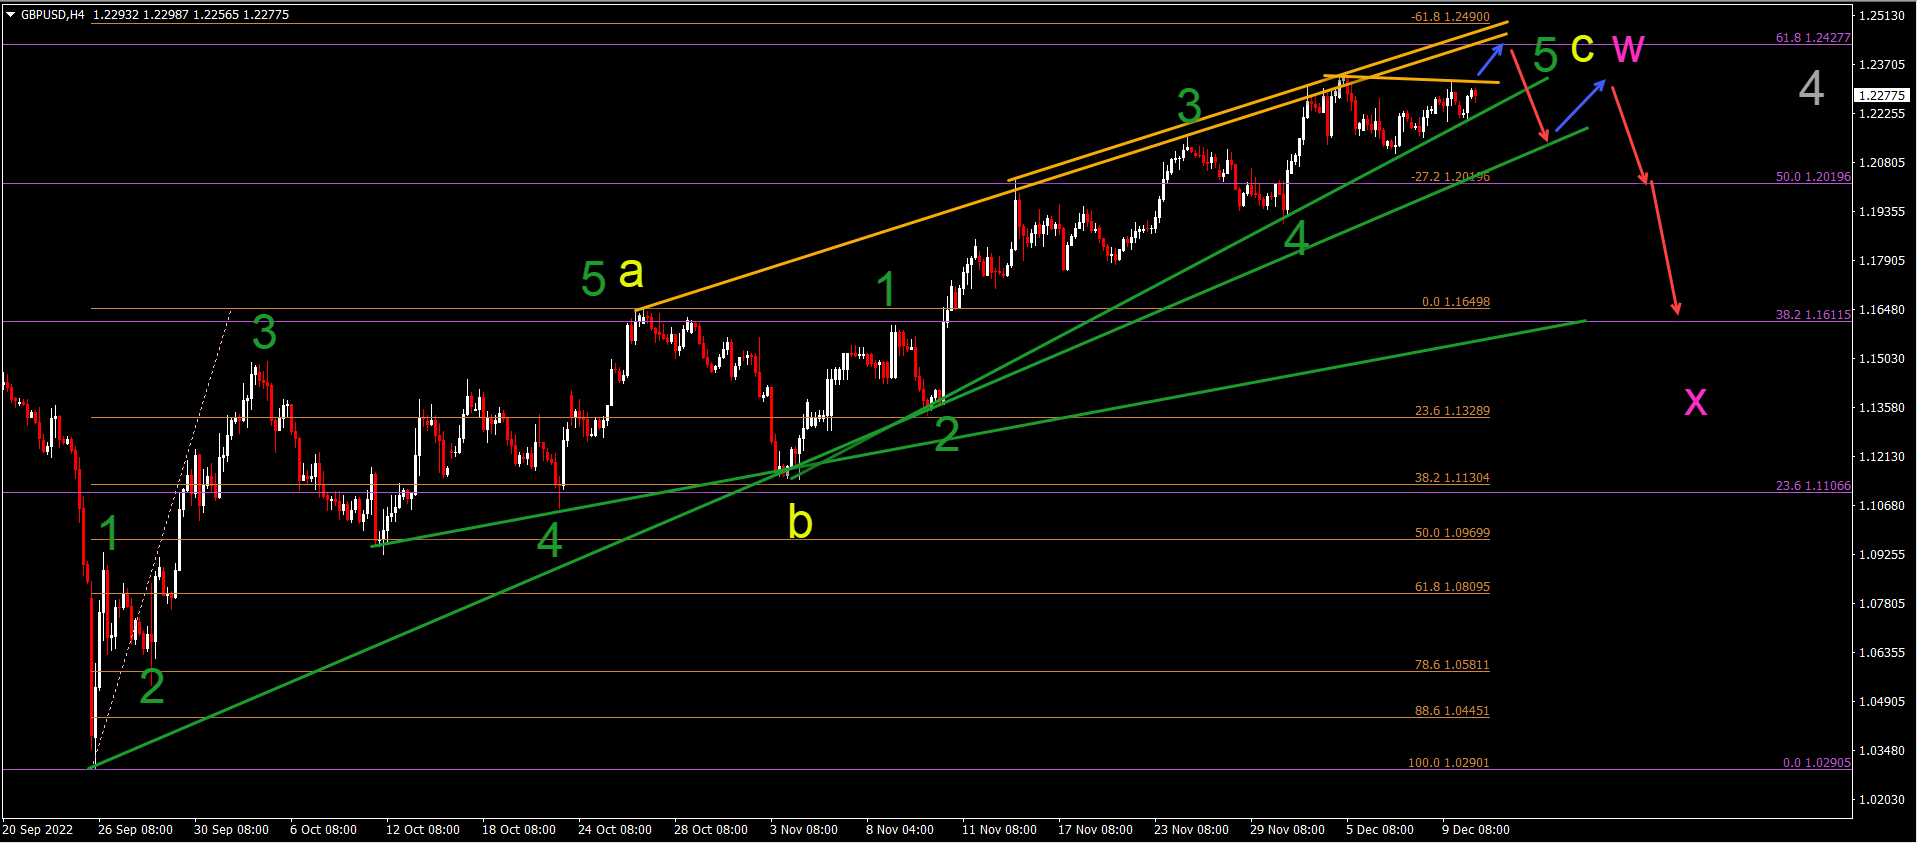
GBP/USD approaches key golden 61.8% Fibs near 1.25
-
The GBP/USD seems to be completing a bullish ABC (yellow) pattern.
-
The 61.8% Fibonacci retracement (purple) level and -61.8% Fibonacci target (brown) level at 1.2425-1.25 could be the main target for the wave C (yellow).
-
A break above the local resistance line (orange) could indicate one more push higher (blue arrow) towards that target zone.
-
Eventually, a larger bearish retracement is expected to take place (red arrows) once price action completes the ABC (yellow) of wave W (pink).
-
A WXY (pink) correction is expected within the wave 4 (gray).
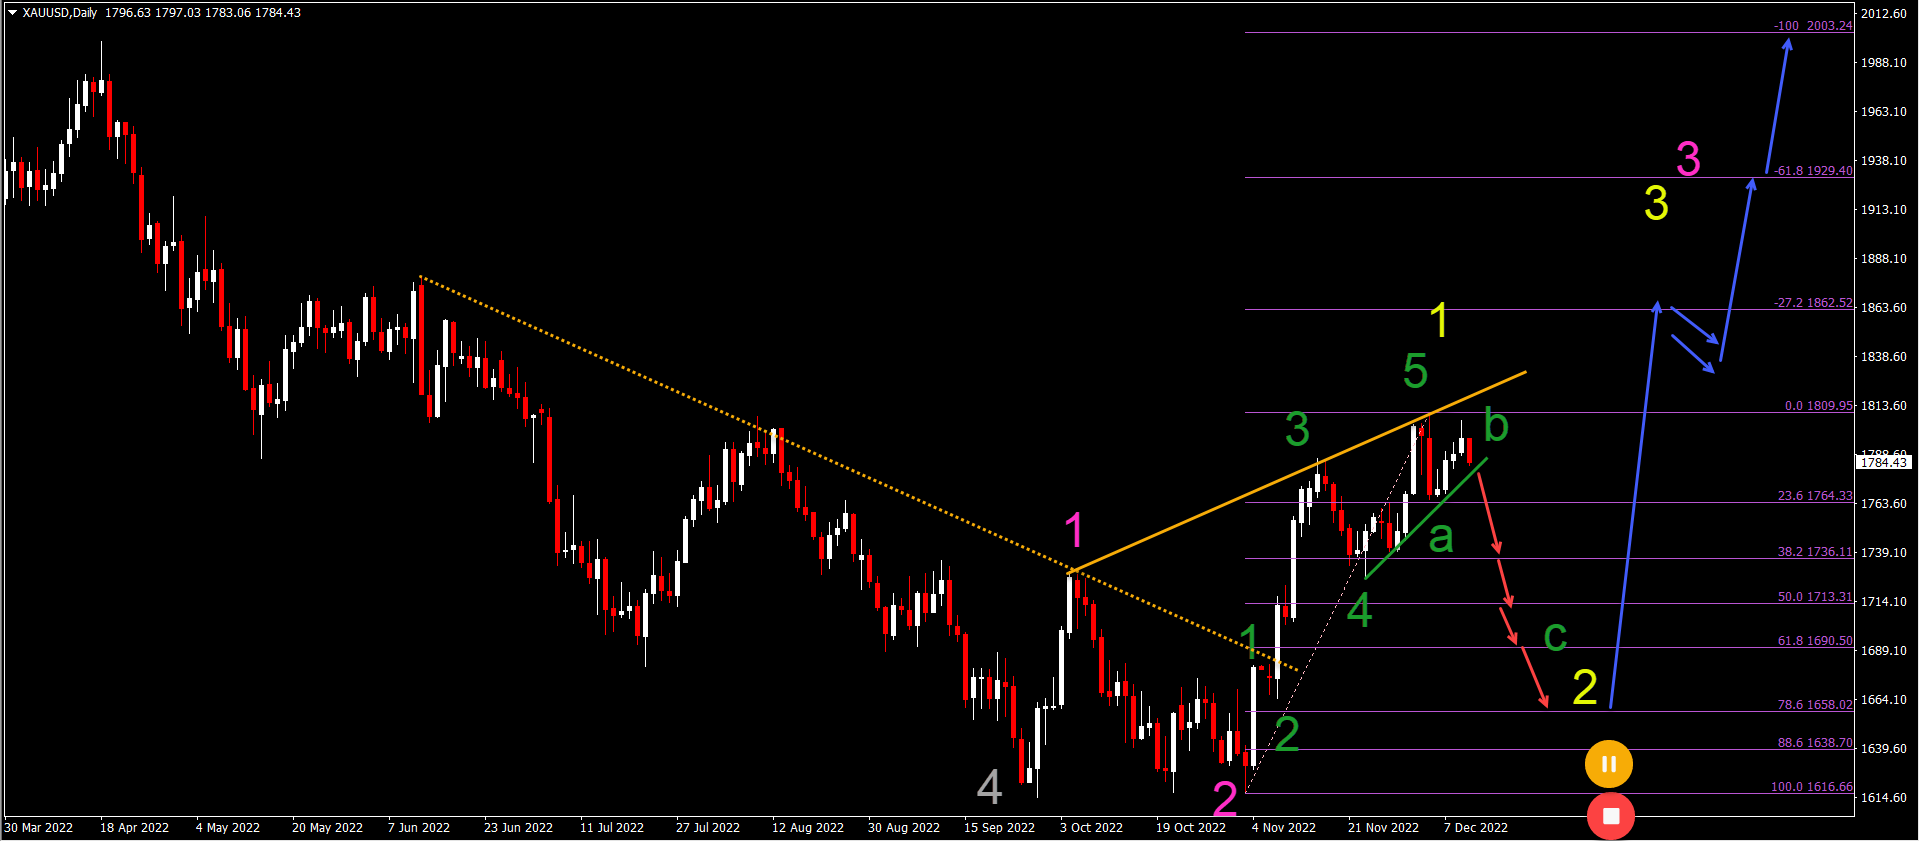
Gold rally requires bearish pullback
Gold (XAU/USD) is making a nice rally but has failed to show a higher high in the past few days:
-
The lack of a higher high and a rising wedge reversal chart pattern (trend lines) could indicate the end of the bullish price swing.
-
In that case, price action seems to have completed a 5 wave pattern (green) in wave 1 (yellow).
-
A break below the support trend line (green) could indicate an ABC (green) retracement within the wave 2 (yellow).
-
The wave 2 (yellow) remains valid as long as price action remains above the 88.6% Fibonacci level and most importantly, the previous bottom.
-
A bullish bounce (blue arrows) at the FIbonacci retracement levels could see price action make a bullish rally towards the Fibonacci targets within waves 3.
The analysis has been done with the indicators and template from the SWAT method simple wave analysis and trading. For more daily technical and wave analysis and updates, sign-up to our newsletter
Author

Chris Svorcik
Elite CurrenSea
Experience Chris Svorcik has co-founded Elite CurrenSea in 2014 together with Nenad Kerkez, aka Tarantula FX. Chris is a technical analyst, wave analyst, trader, writer, educator, webinar speaker, and seminar speaker of the financial markets.


