Weekly Waves: EUR/USD, Dow Jones and Bitcoin

EUR/USD testing key 78.6% Fibonacci level
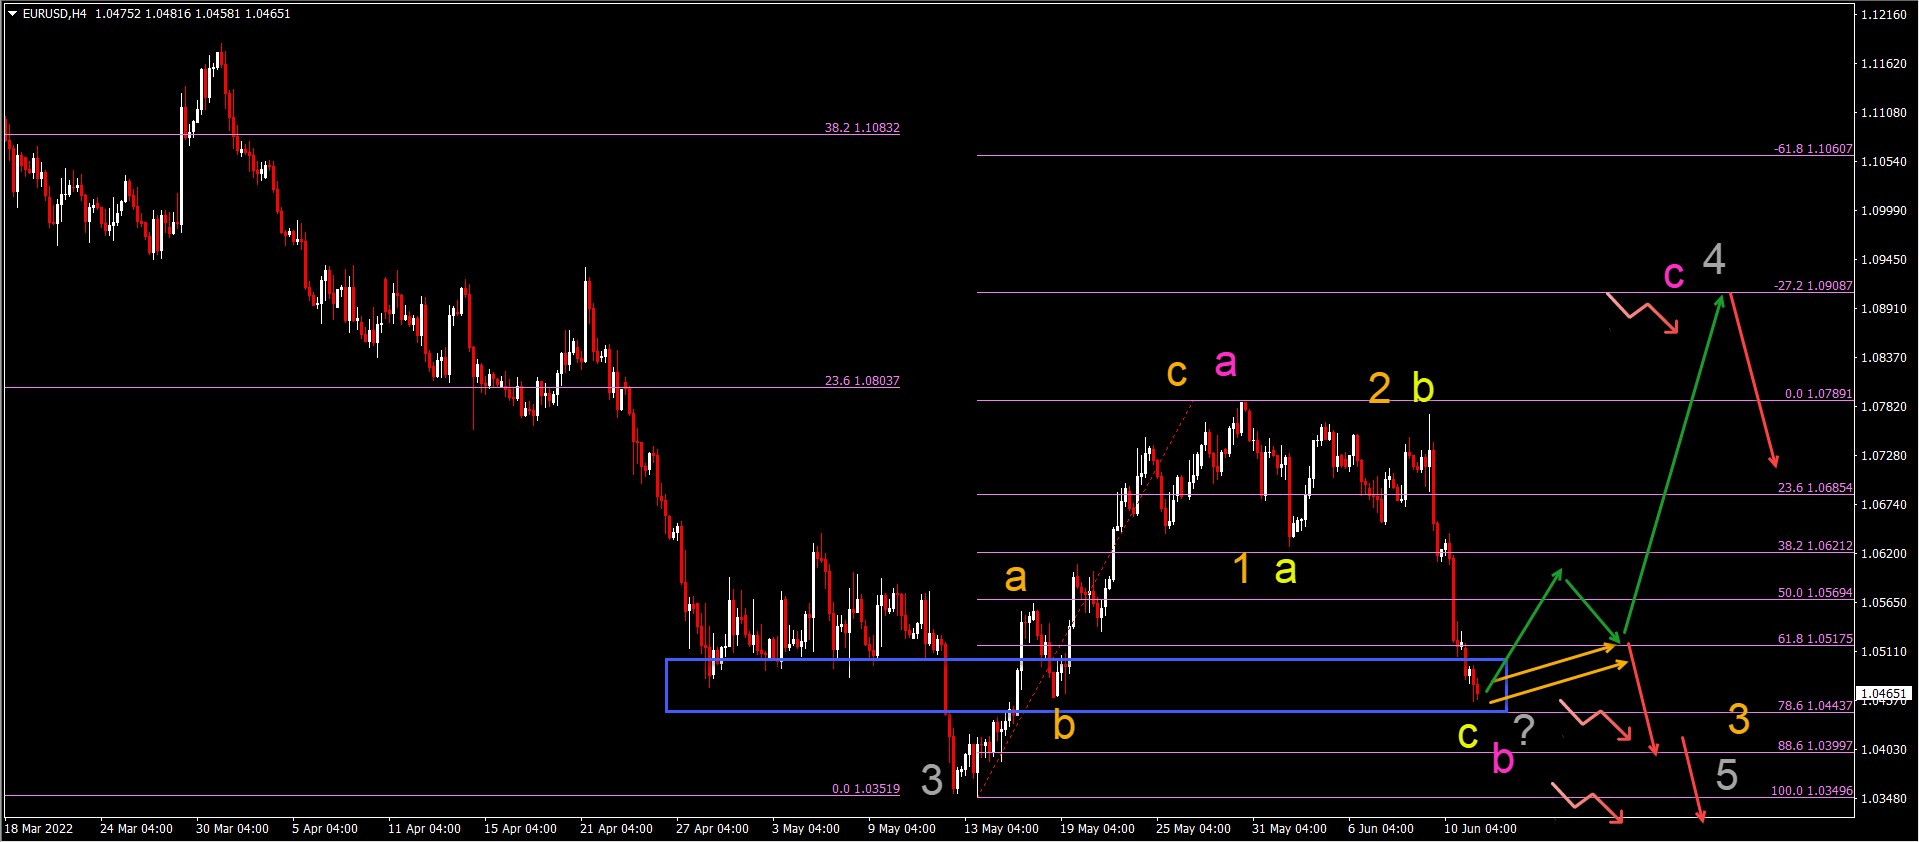
The EUR/USD is making a quick decline - as expected last week - but will the EUR make a bullish bounce at the support? Let’s review:
-
The EUR/USD bearish impulsive price swing was expected. Price action has reached the 61.8-78.6% Fibonacci support levels.
-
The Elliott Wave analysis indicates either an ABC (yellow) pattern of a larger bullish ABC (pink) correction OR a downtrend continuation via a 123 (orange).
-
The main aspect to keep an eye on is the price pattern that develops at the deep Fibonacci retracement levels.
-
A bear flag pattern (orange arrows) indicates a higher chance of a downtrend. In this case, price action probably already completed an ABC (orange) in wave 4 (gray) and price action is moving lower in a 123 (orange).
-
A stronger bullish rebound, however, would indicate a larger ABC (pink) pattern in wave 4 (gray) and a downtrend after a bullish correction takes place.
-
A downtrend usually should aim for targets at 1.0250 and parity (1.00).
BTC/USD dramatic bearish breakout fuels downtrend
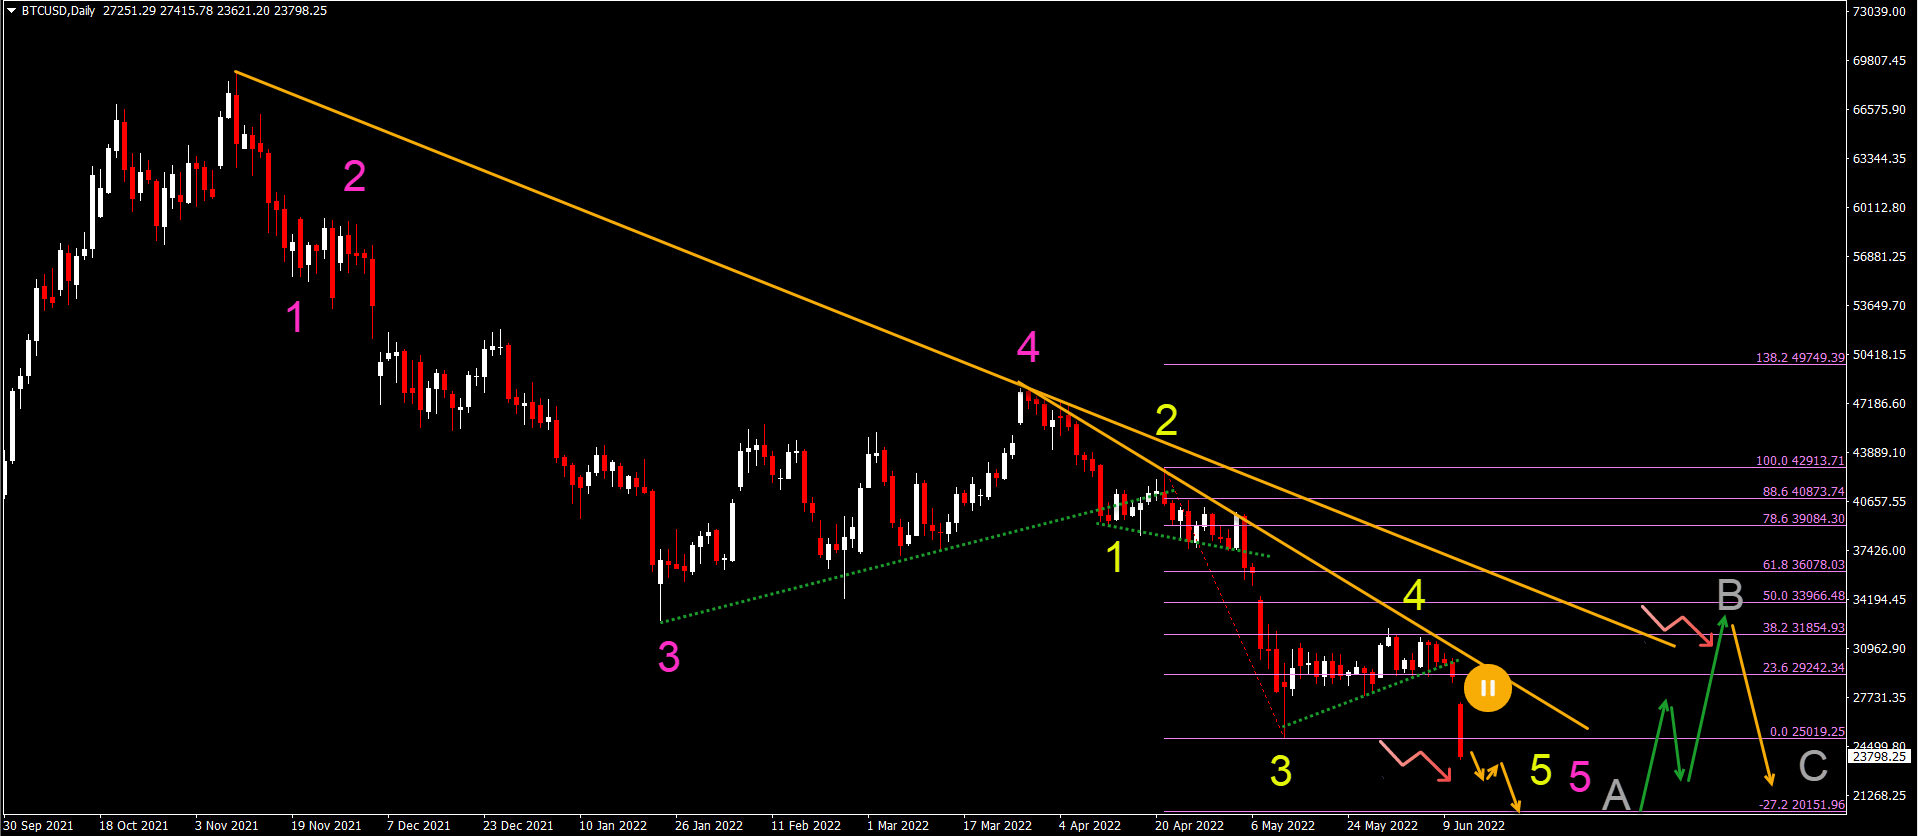
Bitcoin (BTC/USD) created a consolidation pattern and made a bearish breakout to lower price levels:
-
The BTC/USD was unable to break above the 38.2% Fibonacci resistance level. The corrective pattern took two weeks to complete before price action dropped.
-
The bearish breakout below the support trend line (dotted green) sparked yet another sell off in Bitcoin - after a larger downtrend had already emerged.
-
The correction is probably a wave 4 (yellow) because a choppy and shallow retracement is typical for such Elliott Wave patterns.
-
The wave 5 (yellow) could be completed if price action reaches the -27.2% Fibonacci target around the round level of 20k.
-
The wave 5 could complete a larger ABC (gray) pattern. A bullish bounce (green arrows) could complete a wave B (gray) before another wave C.
US30 sees new round of selling again
The US30 stock market found another resistance spot on the chart, which sparked yet another sell-off:
-
The US30 chart is in a downtrend as expected. A new lower high has been confirmed and price action is now testing the 23.6% Fibonacci retracement level again.
-
The downtrend channel is very sturdy and tested but considering the strength of the bears, a push below the support lines (green) of the channel could occur.
-
A further decline to the 38.2% Fibonacci retracement is expected.
-
A few bullish rebounds are expected along the way. But in most cases, the bullish retracements should hit resistance levels within the channel and past support and make a bearish bounce.
-
A bearish ABC (pink) pattern is expected to take place in a larger WXY (gray) of wave 4 (purple).

The analysis has been done with the indicators and template from the SWAT method simple wave analysis and trading. For more daily technical and wave analysis and updates, sign-up to our newsletter
Author

Chris Svorcik
FS method
Chris Svorcik is a trader, analyst, and educator with over 15 years of experience in financial markets, specializing in moving averages, market structure, and price patterns.


