Weekly Waves: EUR/USD, Bitcoin and Dow Jones
- The EUR/USD seems to be building a smaller triangle pattern (4 hour or daily chart) before making a final decline to 1.10 within the wave D of a larger ABCDE triangle
- The Bitcoin crypto pair (BTC/USD) failed to move higher and made a small bearish push instead. But the expected Elliott Wave patterns remains the same
- The US30 chart also saw a slight bearish decline, rather than a small bullish bounce. Price action has now reached the key support zone

Our weekly Elliott Wave analysis reviews the EUR/USD, the Bitcoin crypto currency, and the GBP/USD.
The geopolitical decisions concerning Russia and Ukraine will still heavily weigh into any price movements. But despite all of the news, we will try to offer our best Elliott Wave analysis as possible.
EUR/USD slows down but retest of support expected
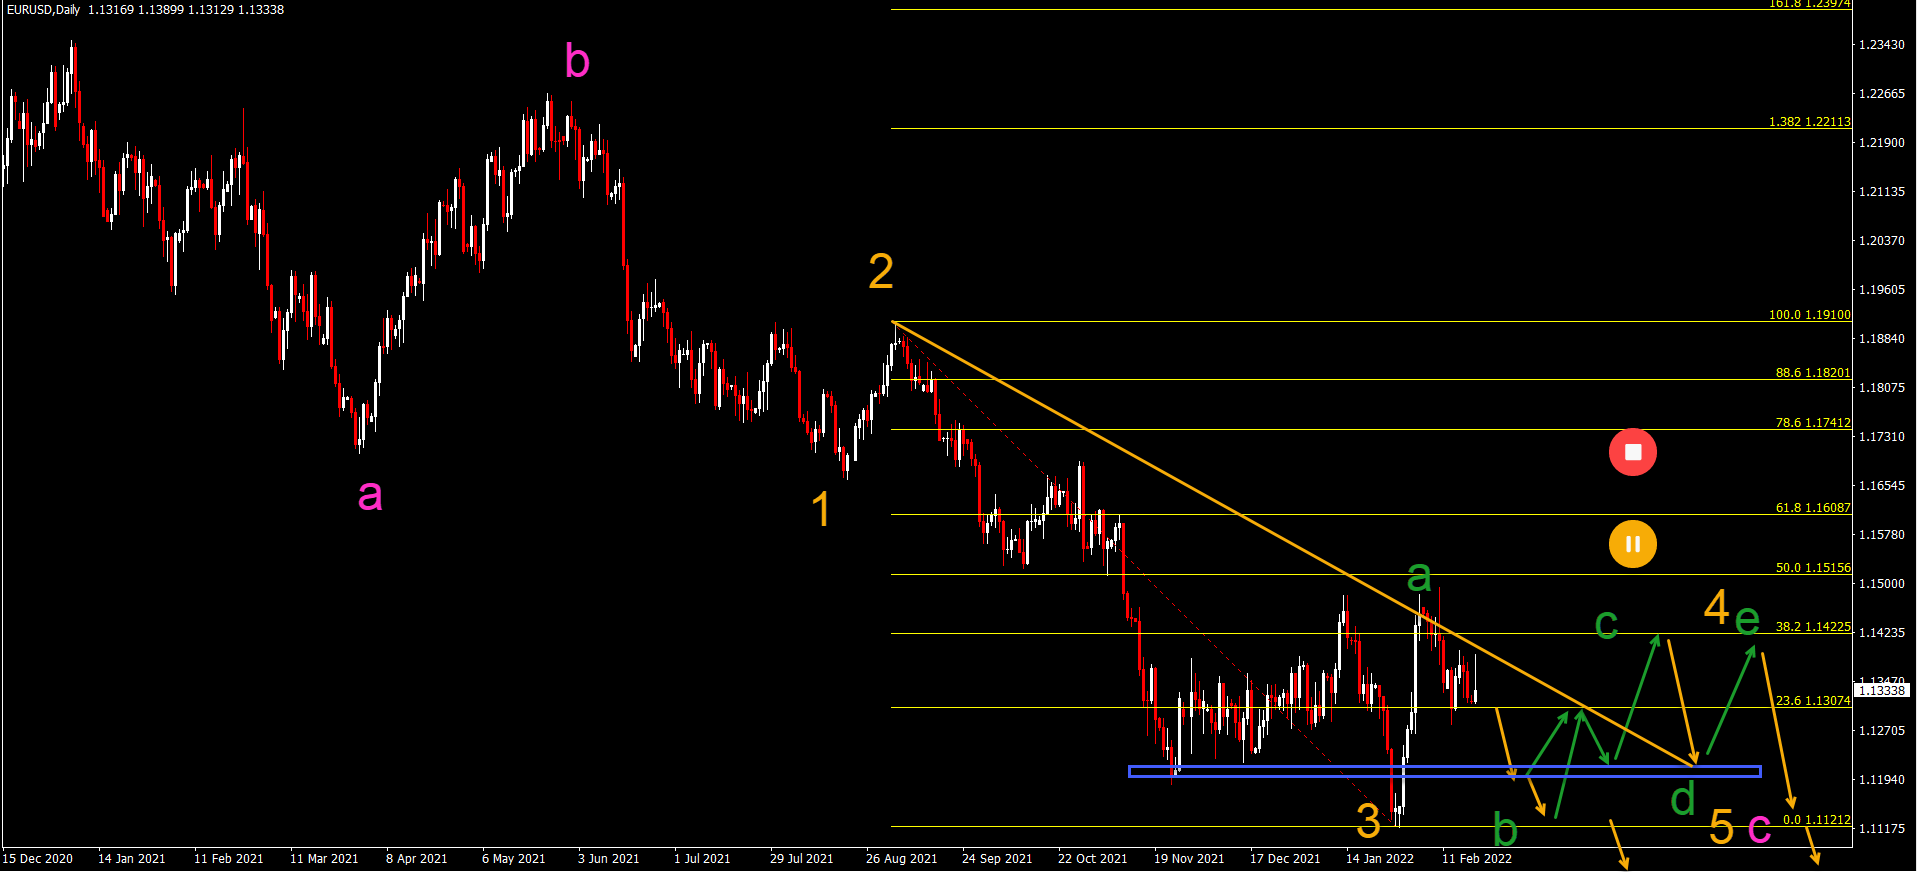
The EUR/USD seems to be building a smaller triangle pattern (4 hour or daily chart) before making a final decline to 1.10 within the wave D of a larger ABCDE triangle (weekly chart).
Within that wave D, price action seems could be building a choppy and sideways correction:
- The new most recent low has probably completed a wave 3 (orange) of a larger wave C (pink). The wave C (pink) could complete a wave D on the weekly chart (see last week).
- The current pullback is expected to be a wave 4 (orange) as long as price action remains captured between the bottom and the 50% Fibonacci retracement level.
- A bullish break above the 50% Fibonacci level places a hold on the bearish outlook whereas a break below the bottom confirms the downtrend.
- The downtrend is not expected in the near future but after the completion of an ABCDE (green) triangle chart pattern within the wave 4 (pink). A break below the bottom could indicate an immediate downtrend.
BTC/USD still expecting bullish ABC pattern
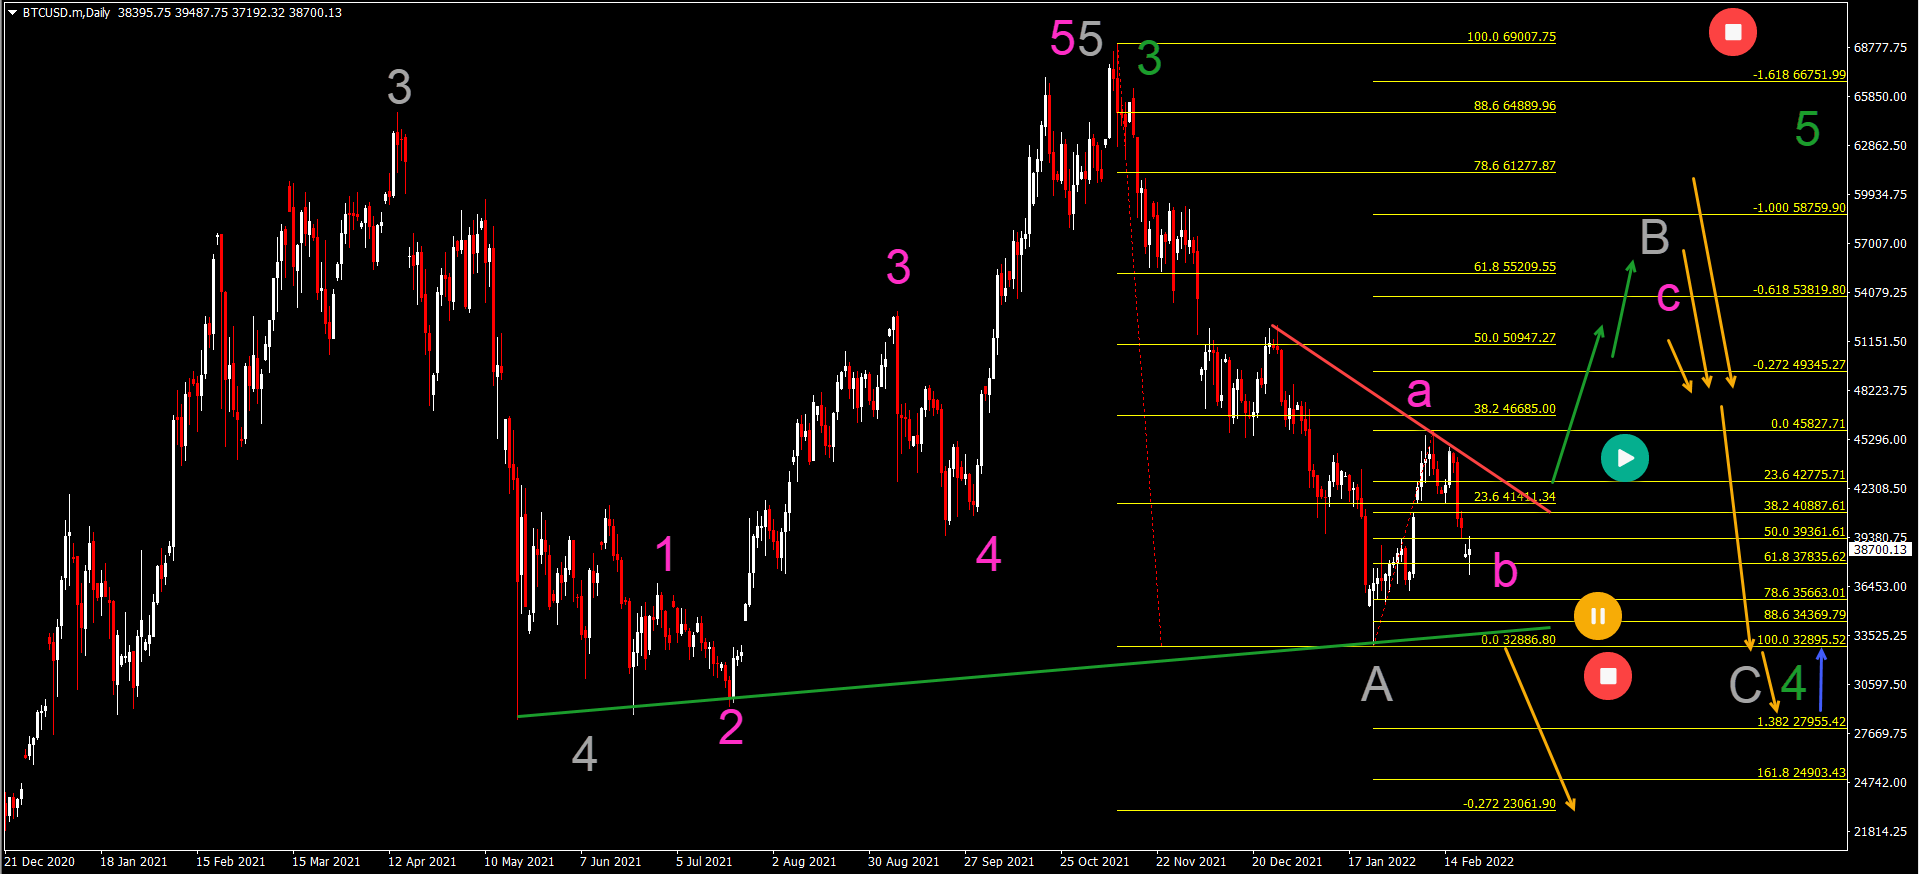
The Bitcoin crypto pair (BTC/USD) failed to move higher and made a small bearish push instead. But the expected Elliott Wave patterns remains the same:
- A bullish ABC (pink) pattern is expected to unfold within the wave B (gray).
- Price action should make a bearish bounce (orange arrows) at the resistance zones.
- A bearish decline would confirm the wave C (gray).
- A bearish ABC (gray) could complete a wave 4 (green) or a wave W of a larger WXY complex correction within wave 4.
- An immediate push below (orange arrow) the support (green line) could invalid the expected bullish ABC pattern.
- Also, a break above the previous top invalidates the expected bearish ABC.
US30 Uptrend Converts Into Range
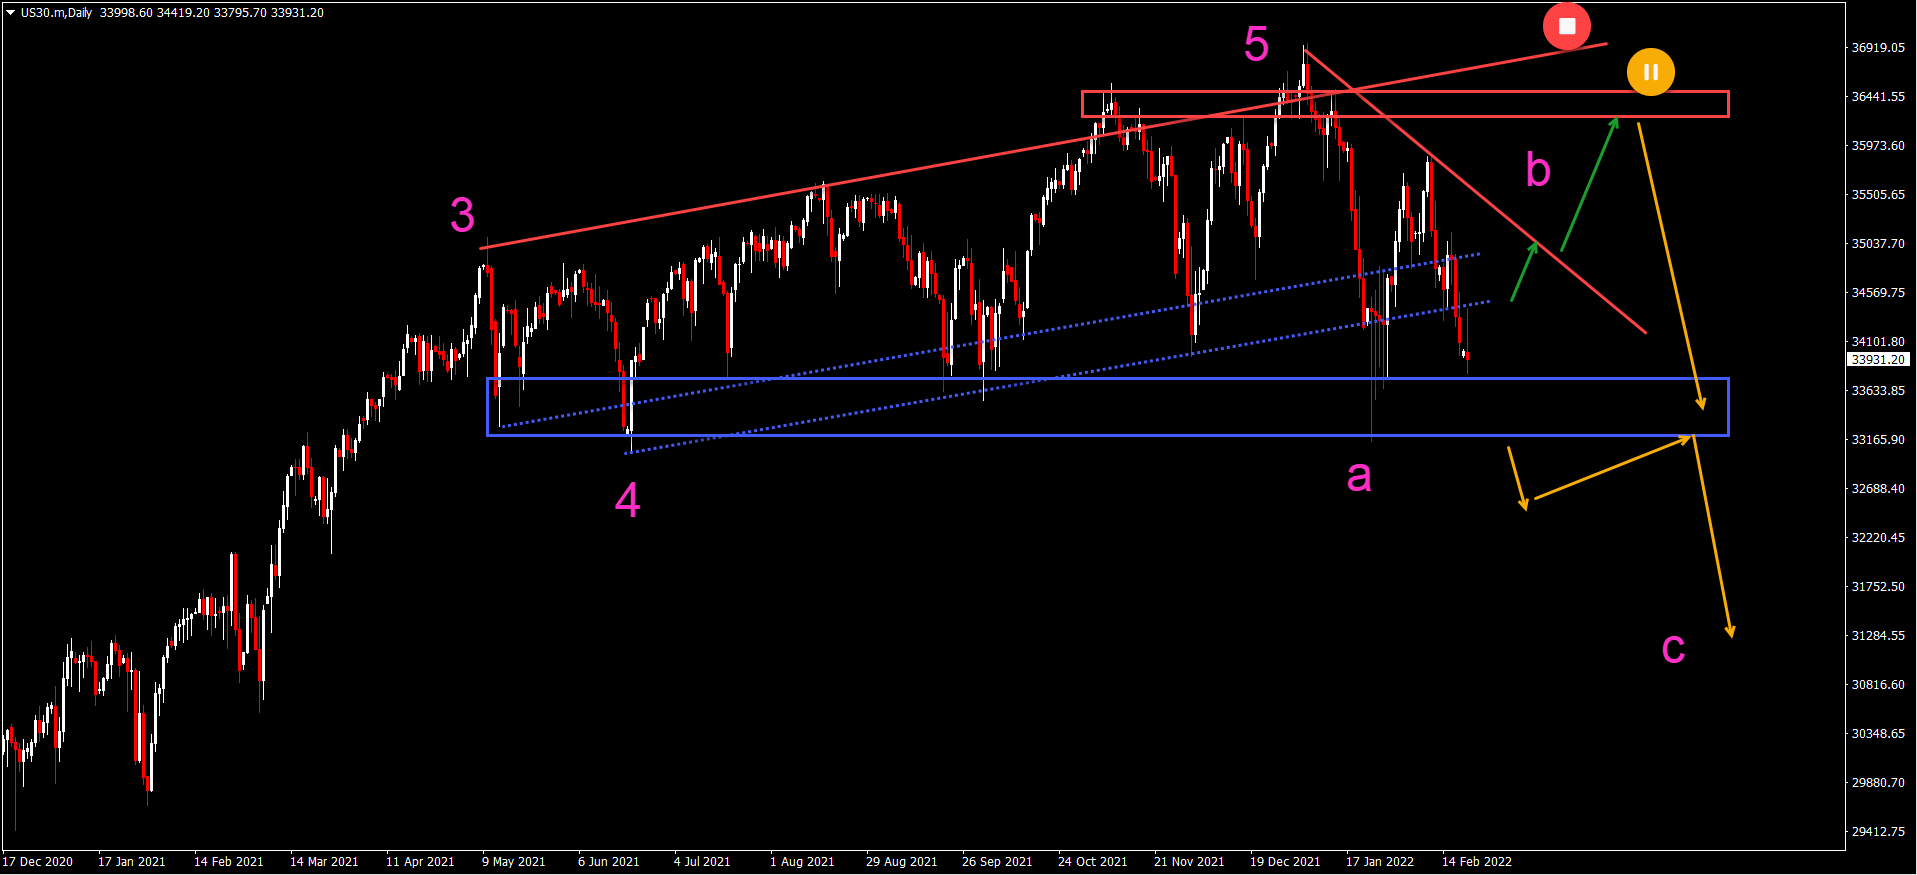
The US30 chart also saw a slight bearish decline, rather than a small bullish bounce. Price action has now reached the key support zone (blue box):
- A bearish breakout below the support zone could indicate an immediate downtrend and retracement. In that case, the uptrend seems to be over - at least temporarily.
- A bullish bounce could retest the resistance (red line). Another breakout could confirm a move towards the resistance zone (red box).
- A bearish bounce at the head and shoulders pattern could confirm the bearish ABC (pink) pattern.
- A break above the resistance would place the bearish retracement on hold.
Author

Chris Svorcik
FS method
Chris Svorcik is a trader, analyst, and educator with over 15 years of experience in financial markets, specializing in moving averages, market structure, and price patterns.


