Weekly Technical Market Insight: The US dollar finished the first full week of 2022 considerably off best levels

(Italics: Previous Analysis Due to Limited Price Change)
US Dollar Index (Daily Timeframe):
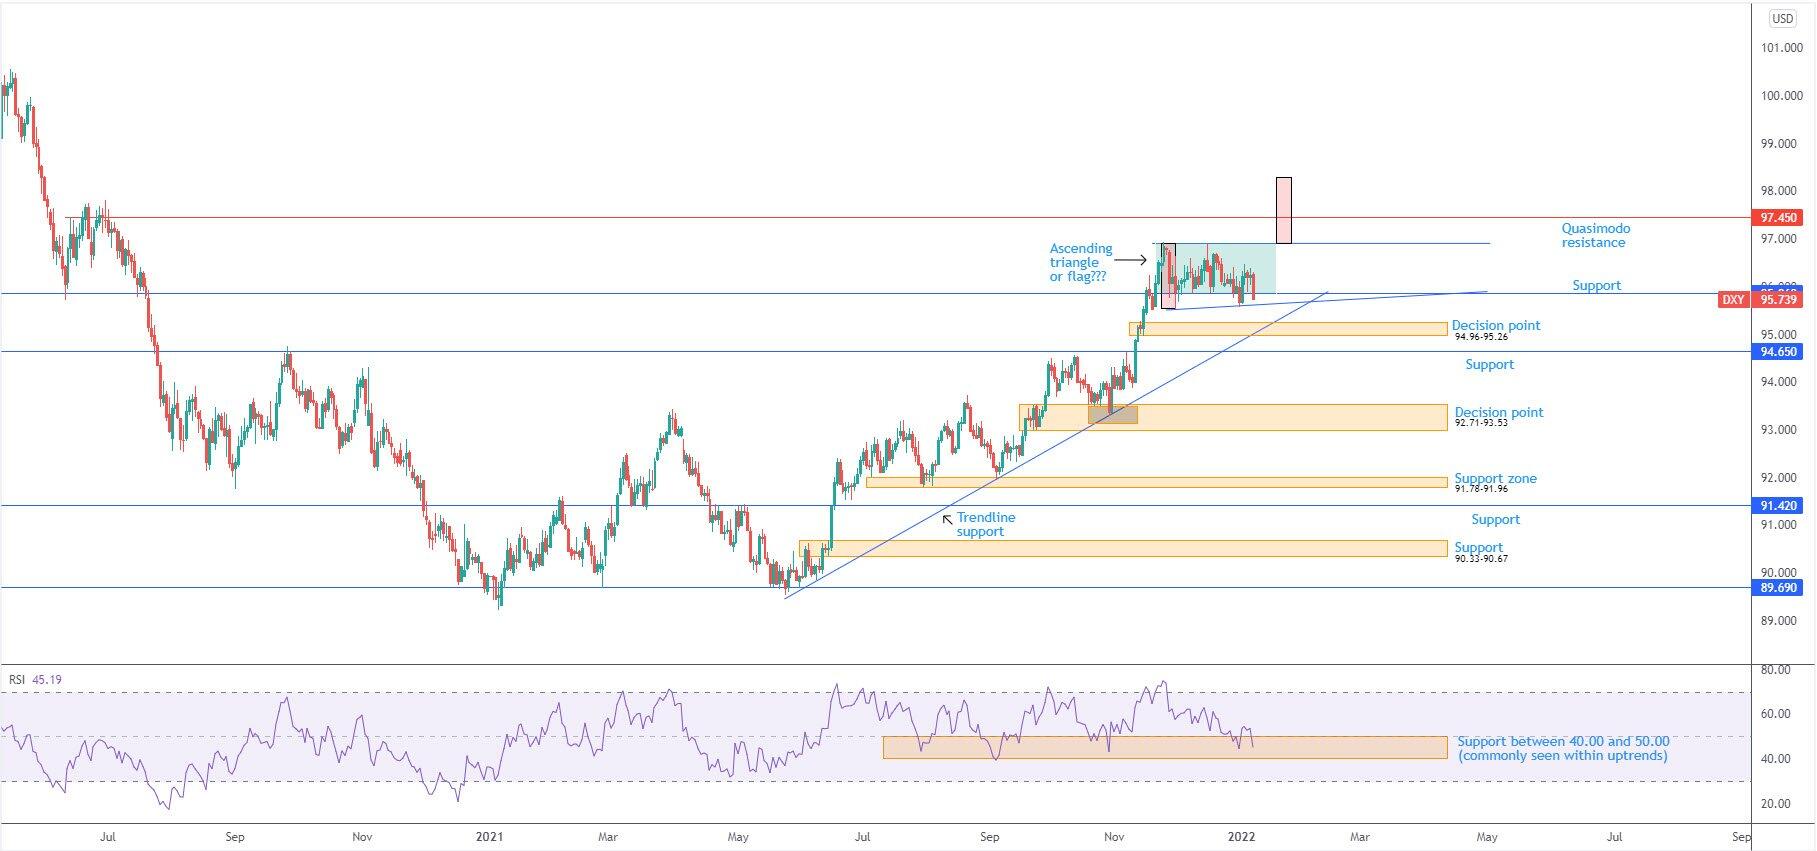
According to the US dollar index, the US dollar finished the first full week of 2022 considerably off best levels. This follows two successive bearish weeks heading into the close of 2021.
Support at 95.86—boasting strong historical significance—served immediate flow well since mid-November 2021. What’s also technically pertinent is current price action forming either an ascending triangle or flag pattern on top of support, both of which echo a bullish ‘flavour’. A breakout to the upside has Quasimodo resistance to target at 97.45, followed by the ascending triangle’s profit objective at 98.29 (red boxes). Alternatively, 95.86 support giving way unchains the door to a decision point from 94.96-95.26 and a trendline support, extended from the low 89.84.
Underpinning 95.86 and the aforementioned pattern structure is trend direction and the relative strength index (RSI).
In terms of trend, the weekly timeframe shows an indecisive market since 2015, ranging between 103.82 and 88.25. The daily timeframe, however, displays an upside bias, established through a series of higher highs and higher lows since price made contact with support from 89.69 in May 2021. The RSI is seen shaking hands with support between 40.00 and 50.00. Note that within trending environments, the indicator tends to construct a ‘temporary’ oversold area around 50.00 and by extension offers a clear area of indicator support.
- Support from 95.86 on the daily timeframe will likely be a key watch for dip-buying interest this week, in line with the current daily uptrend. Should Friday’s sell-off persist, the decision point from 94.96-95.26 and a trendline support, extended from the low 89.84, provide areas to work with.
EUR/USD:
Weekly timeframe:
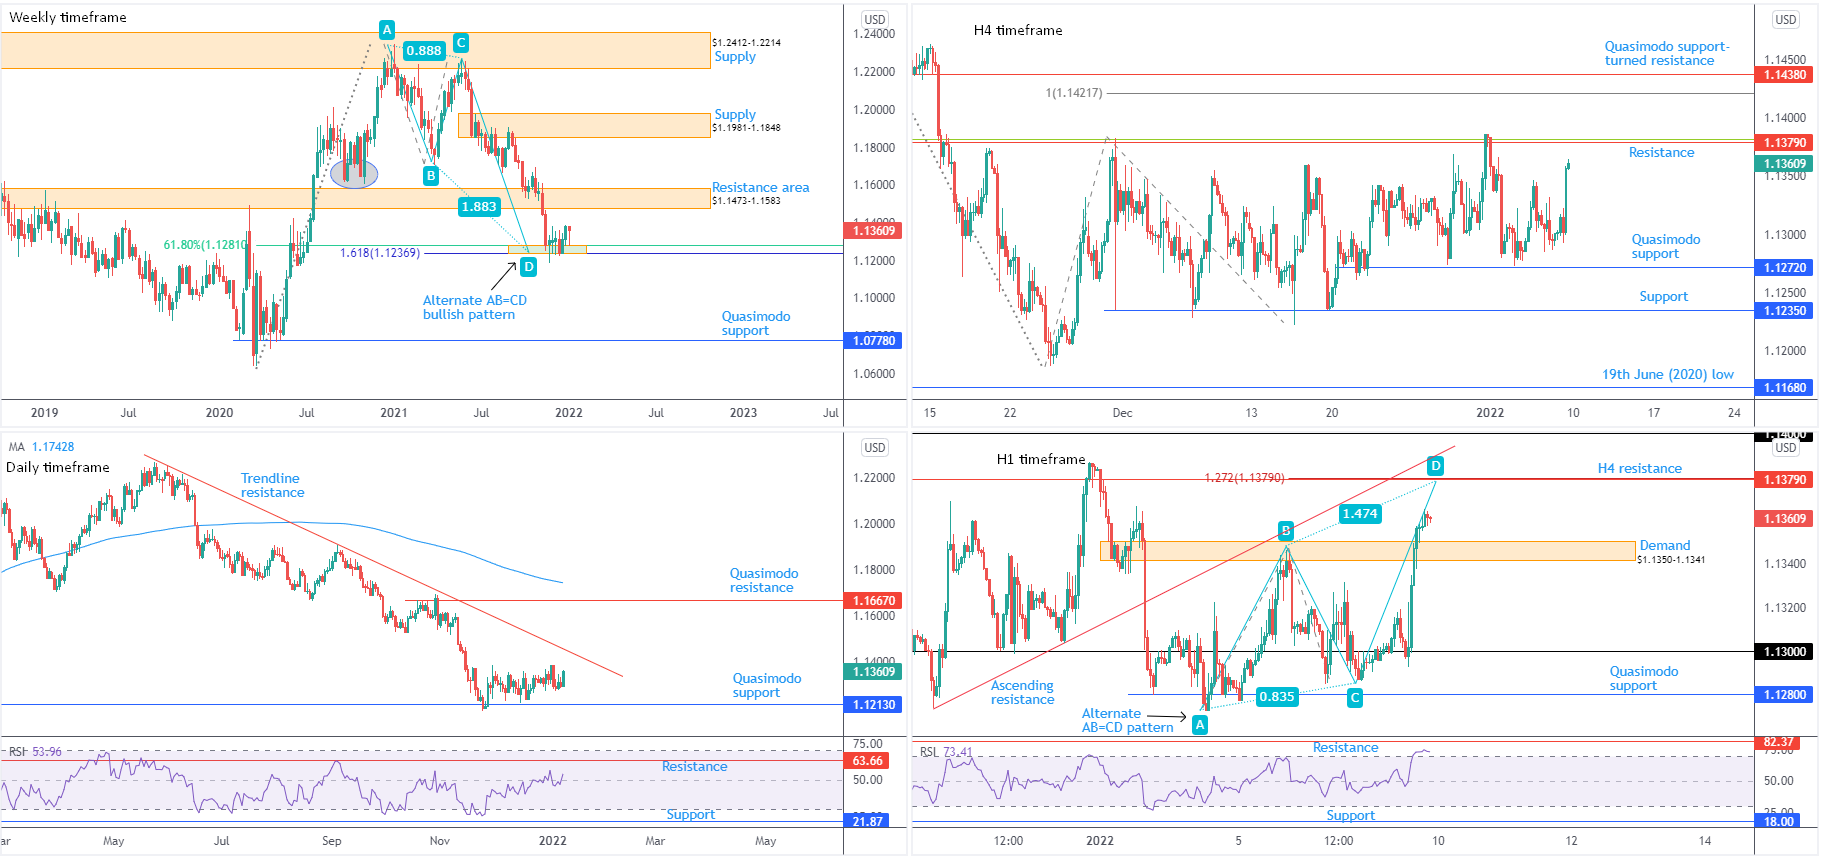
Since mid-November (2021), buyers and sellers have been squaring off around support at $1.1237-1.1281—made up of a 61.8% Fibonacci retracement at $1.1281 and a 1.618% Fibonacci projection from $1.1237. ‘Harmonic’ traders will acknowledge $1.1237 represents what’s known as an ‘alternate’ AB=CD formation (extended D-leg).
Any upside derived from current support will likely be capped by resistance at $1.1473-1.1583; navigating lower, on the other hand, throws light on Quasimodo support as far south as $1.0778.
Interestingly, despite current support, the pair took out 2nd November low (2020) at $1.1603 in late September (2021), suggesting the early stages of a downtrend on the weekly timeframe. This is reinforced by the monthly timeframe’s primary downtrend since mid-2008.
Daily timeframe:
Quasimodo support drawn from mid-June at $1.1213 (positioned beneath the weekly timeframe’s Fibonacci structure) made an entrance on 24th November (2021) and remains committed. Trendline resistance, extended from the high $1.2254, is nearby and could be tested this week, should bulls maintain Friday’s course.
Analysis out of the relative strength index (RSI) reveals the value attempting to establish support from the 50.00 centreline: positive momentum. Indicator resistance resides at 63.66, tucked just under the overbought threshold of 70.00.
Trend on this scale has been lower since June 2021.
H4 timeframe:
Key levels to be mindful of on the H4 scale this week are:
- Quasimodo support from $1.1272.
- Resistance at $1.1379, accompanied by a 38.2% Fibonacci retracement at $1.1381.
- Beyond the above, a 100% Fibonacci projection is visible at $1.1422, followed by Quasimodo support-turned resistance at $1.1438. Lower on the curve, support falls in around $1.1235.
H1 timeframe:
Following Friday’s US non-farm payrolls, EUR/USD bulls strengthened their grip and bid $1.13. Subsequent flow elevated the currency pair beyond the walls of supply from $1.1350-1.1341 and exposed H4 resistance underlined above at $1.1379. This level is accompanied by a 1.272% Fibonacci projection on the H1 chart and an ascending resistance, taken from the low $1.1274.
The 1.272% represents what some Harmonic traders will refer to as an ‘alternate’ AB=CD formation. Unlike equivalent AB=CD patterns (equal AB and CD-legs), an alternate variation has an extended D-leg, extended to either 1.272% or 1.618%.
The relative strength index (RSI) recorded overbought conditions ahead of the week’s end, casting light on indicator resistance at 82.37. Although the overbought space between 100 and 70.00 indicates upside momentum could level off, the indicator might remain around overbought until touching H4 resistance at $1.1379.
Observed Technical Levels:
Long term:
Weekly Fibonacci support between $1.1237 and $1.1281 interacting with price may be enough to pull daily action to trendline resistance this week, extended from the high $1.2254.
In view of the daily timeframe trending lower since June 2021, traders are urged to pencil in the possibility of a bearish attempt from the noted trendline resistance.
Short term:
Friday’s spirited recovery phase, lifting H1 above $1.1350-1.1341, centres attention on H4 resistance from $1.1379. Sharing space with an alternate AB=CD bearish pattern on the H1 chart and an ascending resistance, as well as a 38.2% Fibonacci retracement at $1.1381 on the H4 chart, sellers could be drawn to the $1.1379 area this week.
Prior to reaching $1.1379, a short-term dip-buying phase may develop off $1.1350-1.1341 early week, targeting the aforementioned resistance.
AUD/USD:
Weekly timeframe:
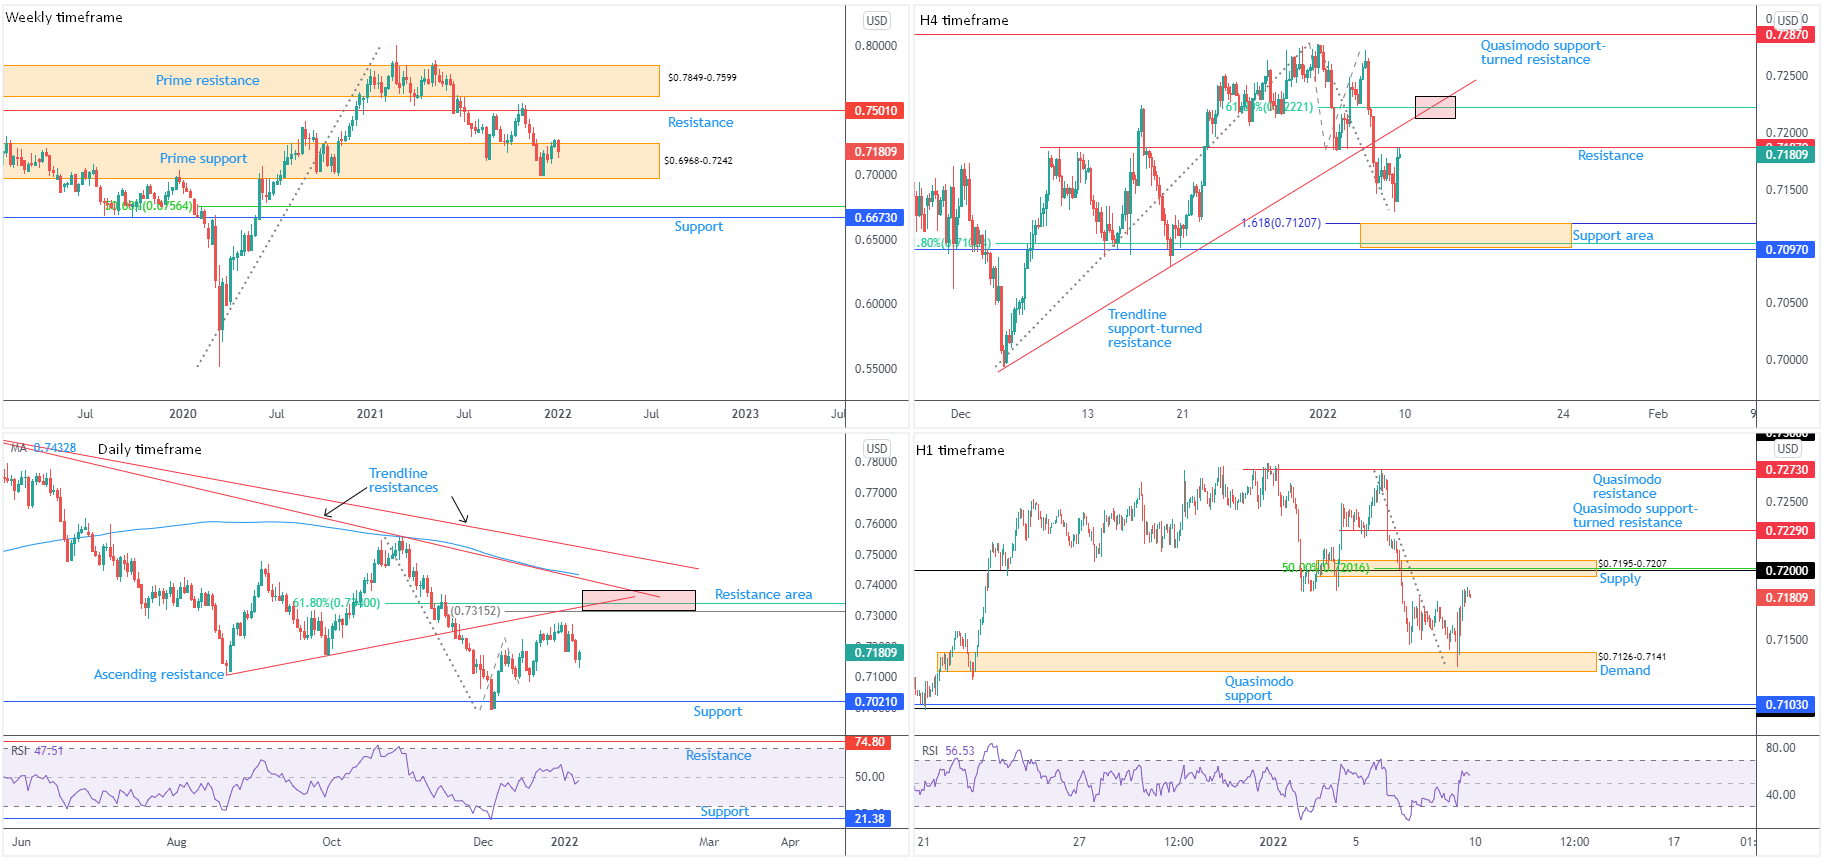
Prime support at $0.6968-0.7242 continues to play a crucial role on the weekly timeframe. Bulls, as you can see, welcomed a bullish phase into the close of 2021, though appetite for higher prices subsided last week, closing lower by 1.2 percent. Should buyers regain footing, resistance is formed at $0.7501; manoeuvring beneath $0.6968-0.7242 reveals support at $0.6673 and a 50.0% retracement at $0.6756.
Since mid-Feb 2021, a downside bias has been seen. This follows higher prices since pandemic lows of $0.5506 (March 2020). However, from the monthly timeframe the unit has been entrenched within a large-scale downtrend from mid-2011.
Daily timeframe:
Resistance—made up of a 61.8% Fibonacci retracement at $0.7340, a 100% Fibonacci projection at $0.7315, an ascending resistance, drawn from the low $0.7106, and a trendline resistance, drawn from the high $0.7891—offers healthy (technical) confluence.
Support at $0.7021 calls for attention to the downside in the event sellers track lower price levels this week.
The relative strength index (RSI) elbowed beneath the 50.00 centreline at the tail end of the week, movement informing traders and investors this market is beginning to produce negative momentum (average losses exceeding average gains).
H4 timeframe:
Friday sailed to a low just ahead of support between $0.7097 and $0.7121 (composed of a 1.618% Fibonacci projection, a 61.8% Fibonacci retracement and horizontal price support), before spinning higher and running into resistance from $0.7187 (located just south of trendline support-turned resistance, taken from the low $0.6993, and a 61.8% Fibonacci retracement at $0.7222).
In fact, the point at which trendline resistance and the 61.8% Fibonacci retracement merge could be an area the chart attracts bearish attention (red zone).
H1 timeframe:
While H4 resistance at $0.7187 is in play, H1 price is on the verge of connecting with supply at $0.7195-0.7207, which happens to include the $0.72 psychological figure and a 50.0% retracement at $0.7202. Any downside attempts from the aforementioned zone will likely zero in on demand at $0.7126-0.7141 (held during Friday’s NFP release).
Upstream, the technical radar points to a Quasimodo support-turned resistance at $0.7229. Interestingly, this level dovetails closely with the H4 61.8% Fibonacci retracement at $0.7222.
The relative strength index (RSI) crossed above the 50.00 centreline threshold on Friday, a move notifying short-term players that average gains are exceeding average losses: positive momentum until reaching overbought. Consequently, additional upside momentum may haul price into the H1 supply area at $0.7195-0.7207 early week.
Observed Technical Levels:
Long term:
Technically, we are in a prime support zone on the weekly timeframe at $0.6968-0.7242, unlocking the possibility of a run higher on the daily chart until crossing swords with resistance around the $0.7340ish point (see above). It is here, in light of the downtrend seen on the daily scale and the long-term downtrend on the monthly timeframe, long-term sellers could emerge.
Short term:
The combination of H4 resistance at $0.7187 and H1 supply at $0.7195-0.7207 (and associated H1 technical confluence) delivers immediate short-term confluence to work with early week.
A touch higher, technical eyes will be on H1 Quasimodo support-turned resistance at $0.7229, which, as noted above, overlaps closely with H4 resistance around $0.7222 (red area).
USD/JPY:
Weekly timeframe:
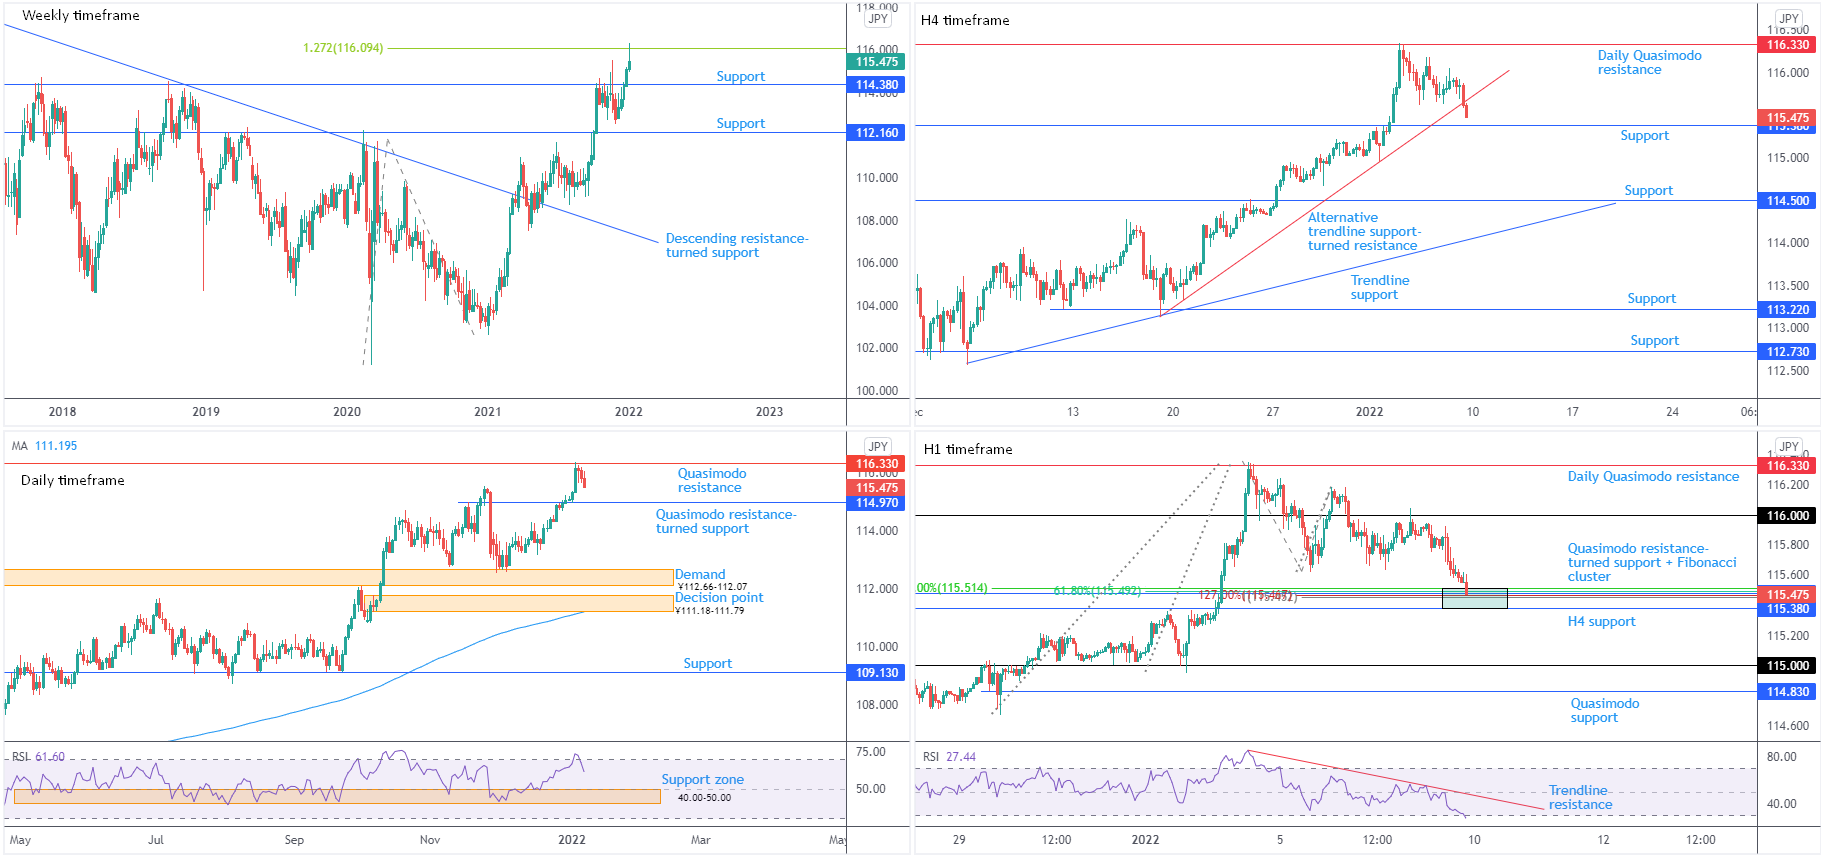
USD/JPY kicked off 2022 touching gloves with a 1.272% Fibonacci projection from ¥116.09, following a one-sided break of resistance from ¥114.38, a level capping upside since early 2017 which now represents support. Also of technical note is the currency pair recently refreshing multi-year pinnacles, reaching levels not seen since January 2017.
In terms of trend, the unit has been advancing since the beginning of 2021, welcoming a descending resistance breach, drawn from the high ¥118.61.
Daily timeframe:
Quasimodo resistance at ¥116.33 made a show early last week, powering three back-to-back daily bearish closes. Taking the market’s current trend into account, the ¥116.33 reaction may prompt a dip-buying phase from ¥114.97 this week, a Quasimodo resistance-turned support.
RSI (relative strength index) analysis had the indicator exit overbought space in recent trading. This is generally considered a bearish signal, and could lead to the value extending lower to connect with support between 40.00 and 50.00. On a related note, a ‘temporary’ oversold range can often be seen around the 50.00 neighbourhood in defined uptrends (since 10th May 40.00-50.00 has offered an oversold region on this timeframe).
Regarding trend, the unit has been higher since 2021.
H4 timeframe:
H4 dipped a toe south of trendline support, drawn from the low $113.14, indicating further underperformance in the direction of support coming in at ¥115.38 in early trading this week. Should the pair continue to pursue lower territory, additional support is not visible until ¥114.50, arranged a handful of pips beneath the daily timeframe’s Quasimodo resistance-turned support at ¥114.97.
In line with the underlying trend of this market, if price eventually dethrones the daily Quasimodo resistance at ¥116.33, $117.76-117.07 supply (H4) is fixed above the daily level (not visible on the screen); therefore, a break of ¥116.33 shows room to press higher.
H1 timeframe:
Local lows around ¥115.63 were absorbed during US trading on Friday, unshackling a shift to Quasimodo resistance-turned support at ¥115.48 and a Fibonacci cluster between ¥115.45 and ¥115.51. Bracing this area is neighbouring support on the H4 timeframe at ¥115.38. Further technical confluence arises from the relative strength index (RSI) probing oversold space into the close.
Failure to offer a ‘floor’ early week around ¥115.48, this invites additional underperformance towards the ¥115 psychological figure, a level benefitting from a daily Quasimodo resistance-turned support at ¥114.97.
Observed Technical Levels:
Long term:
On the one hand, the USD/JPY is entrenched within an uptrend for now, clearly realised on both weekly and daily timeframes. Against this background, nevertheless, weekly resistance at ¥116.09 (the 1.272% Fibonacci projection) and daily Quasimodo resistance at ¥116.33 is likely to remain a talking point, particularly for bullish setups, long term.
Short term:
Although higher timeframe resistance is evident in this market, the underlying trend reinforces current H1 and H4 support between ¥115.38 and ¥115.51. As a consequence of higher timeframe resistance, interested traders from the shorter-term support may elect to wait for additional price confirmation before committing (think bullish candlestick formations or a lower timeframe resistance breach, for example).
Should ¥115.38-115.51 yield this week, a short-term bearish scenario could unfold towards ¥115 (H1) and daily support from ¥114.97.
GBP/USD:
Weekly timeframe:
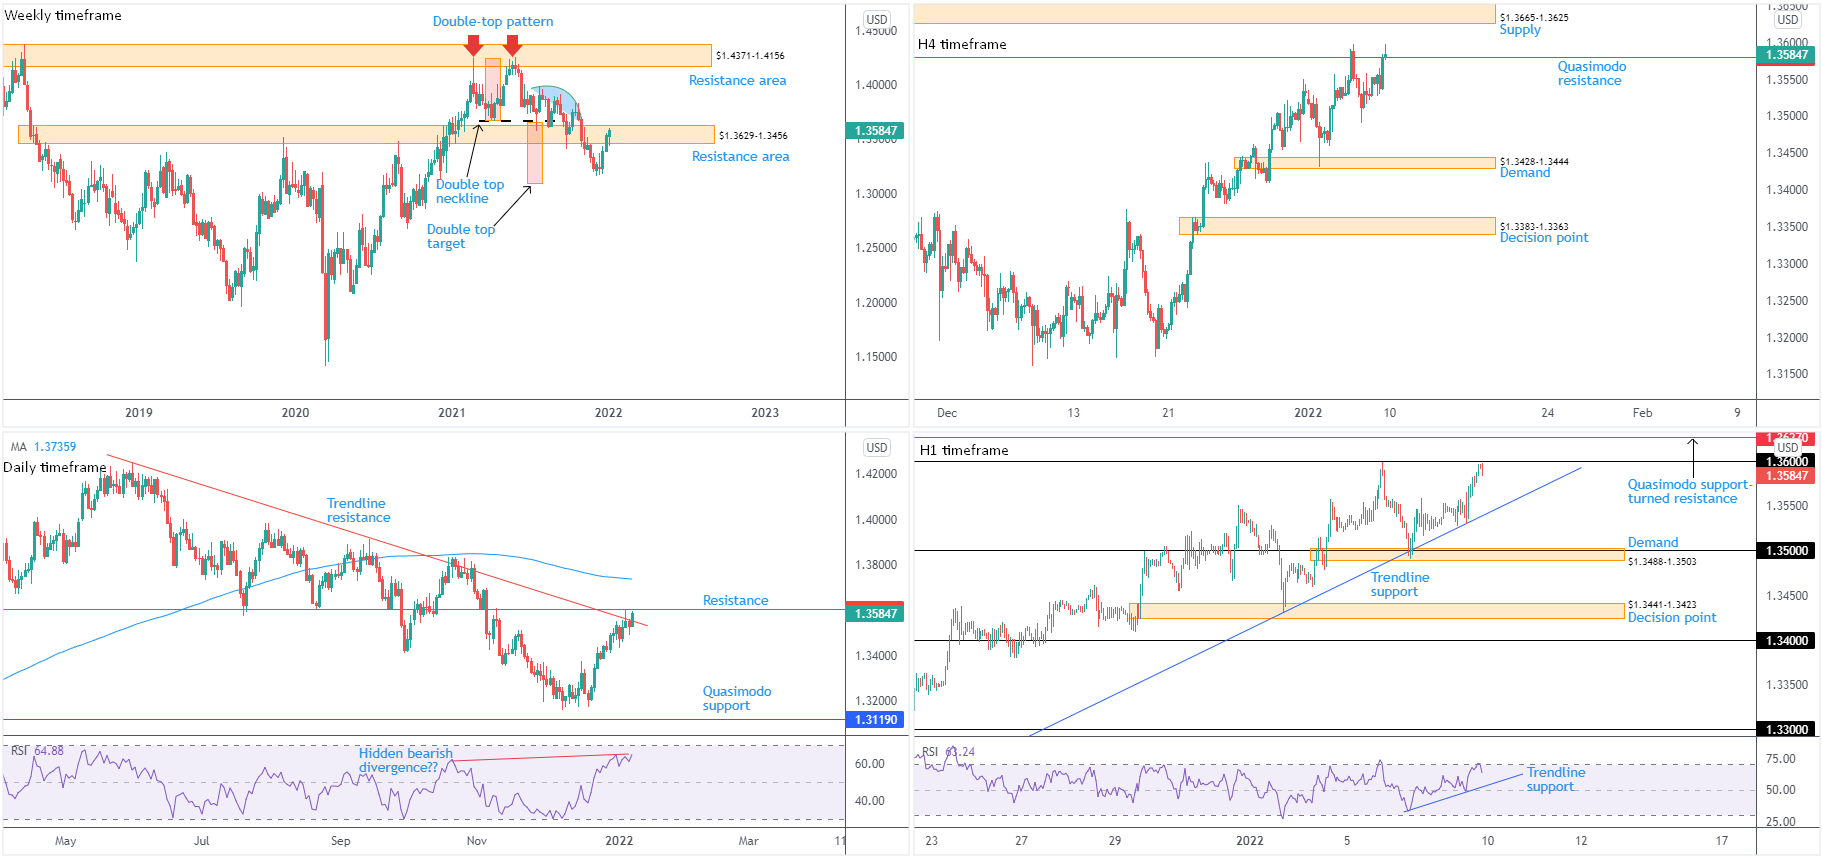
Resistance at $1.3629-1.3456 made a show in recent weeks, following a pullback from December lows of $1.3160 just ahead of the double-top pattern’s ($1.4241) profit objective around $1.3093 (red boxes). Could this be the beginning of a dip-buying phase, in line with the weekly timeframe’s current uptrend? Still, it’s important to recognise that while the trend on the weekly timeframe demonstrates an upside bias, the monthly timeframe’s long-term trend has been lower since late 2007.
If resistance at $1.3629-1.3456 fails to deliver, ‘consumed supply’ (blue area) is visible between $1.4001 and $1.3830. Considering this, a resistance breach might guide the currency pair as far north as resistance from $1.4371-1.4156.
Daily timeframe:
Trendline resistance, taken from the high $1.4250, came under modest pressure Friday and landed price within a stone’s throw of neighbouring resistance from $1.3602. Both technical structures remain a possible headwind for GBP/USD this week.
The 200-day simple moving average is circling above current resistance at $1.3736. If this dynamic value is eventually challenged, note that moving averages (in particular the 200-day setting) can serve a support and resistances.
Interestingly, the relative strength index (RSI) is hovering nearby overbought levels and is in the early stages of hidden bearish divergence.
H4 timeframe:
Quasimodo resistance at $1.3580 appears fragile, having failed to find acceptance beyond $1.3490 lows. Supply coming in at $1.3665-1.3625, therefore, is recognised as a viable upside objective this week, with subsequent buying perhaps reaching resistance at $1.3710.
Demand is equally important to note at $1.3428-1.3444, receiving price action at the beginning of last week as traders capitalised on ‘dip-buying’ movement. As a result, if sellers regain consciousness from $1.3580, the week may witness a dip back to the aforementioned demand zone.
H1 timeframe:
Following Thursday’s response from demand at $1.3488-1.3503 (enclosing the $1.35 psychological figure and converging with trendline support, etched from the low $1.3173), buyers of GBP/USD were robust into the week’s close.
$1.36 is directly overhead and capable of producing resistance. In spite of this, the psychological figure is in a vulnerable position. Above, a Quasimodo support-turned resistance ($1.3627) is seen within the walls of H4 supply at $1.3665-1.3625, and could attract a whipsaw (stop run) above $1.36.
In terms of the relative strength index (RSI), overbought conditions were registered late in the session Friday which suggests sellers might take the wheel early trade this week.
Observed Technical Levels:
Long term:
Although weekly resistance at $1.3629-1.3456 has yet to offer much of a ‘ceiling’, overlooking this area is not recommended as daily resistance between trendline resistance and horizontal resistance at $1.3602 remains in play.
Short term:
In conjunction with higher timeframe resistances, a whipsaw north of $1.36 is a possibility on the H1 timeframe to test H4 supply at $1.3665-1.3625 and the H1 Quasimodo support-turned resistance from $1.3627.
Conservative traders will likely watch for a test of $1.3665-1.3625 and a subsequent close back under $1.36 to form before pulling the bearish trigger. A visible downside target from this region is H1 trendline resistance, coming from the low $1.3173.
Author

Aaron Hill
FP Markets
After completing his Bachelor’s degree in English and Creative Writing in the UK, and subsequently spending a handful of years teaching English as a foreign language teacher around Asia, Aaron was introduced to financial trading,


