Weekly Market Brief: S&P 500 consolidating, but internal indicators that are alluding to possible declines

S&P 500 stocks above 50MA
|
Financial index |
Current price* |
Forecast |
S1 |
R1 |
S2 |
R2 |
|---|---|---|---|---|---|---|
|
FTSE100 |
7,334 |
Bearish |
7,000 |
7,400 |
6,850 |
7,600 |
|
FTSEMIB |
23,282 |
Bearish |
21,500 |
23,600 |
20,700 |
24,500 |
|
DAX40 |
13,459 |
Bearish |
12,200 |
13,600 |
11,500 |
14,000 |
|
S&P 500 |
3,770 |
Cons./ Bearish |
3,550 |
3,900 |
3,400 |
4,100 |
|
NASDAQ 100 |
10,857 |
Consolidation |
10,400 |
12,000 |
10,000 |
12,700 |
|
DOW JONES |
32,403 |
Cons./ Bearish |
30,170 |
33,250 |
29,170 |
34,150 |
|
TADAWUL |
11,606 |
Consolidation |
11,250 |
12,270 |
10,900 |
12,650 |
|
FTSE ADX |
10,482 |
Cons./ Bearish |
9,615 |
10,500 |
9,160 |
10,500 |
|
DFM |
3,350 |
Consolidation |
3,270 |
3,500 |
3,100 |
3,730 |
|
Indicator |
Current price |
Forecast |
S1 |
R1 |
S2 |
R2 |
|---|---|---|---|---|---|---|
|
VIX index |
24.56 |
Cons./ Bullish |
20.00 |
35.00 |
11.00 |
41.00 |
|
US dollar index (DXY) |
110.788 |
Cons./ Bullish |
105.00 |
110.50 |
103.00 |
114.00 |
|
US10 years yield |
4.163% |
Consolidation |
3.500% |
4.000% |
3.200% |
4.400% |
|
S5FI* |
57.37 |
Cons./ Bearish |
40 |
80 |
30 |
90 |
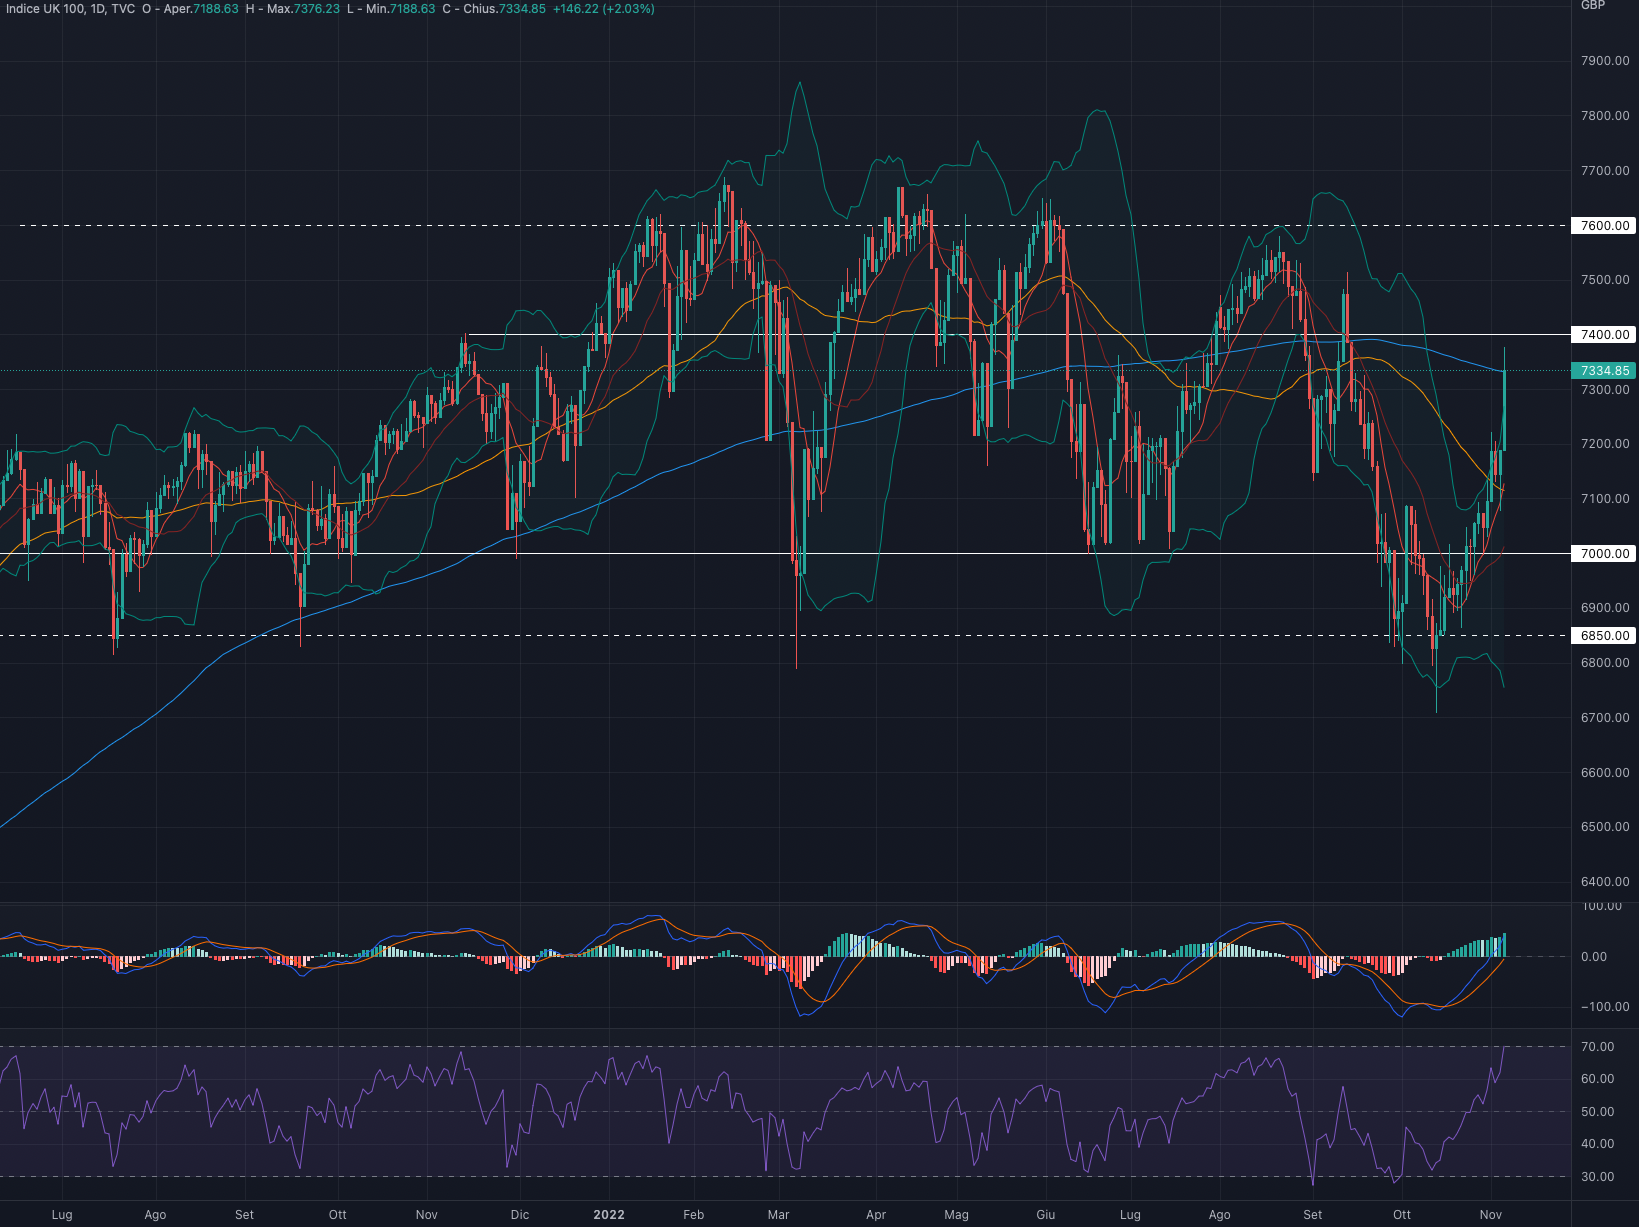
FTSE 100 (UKX)
The FTSE100 index had a week up by + 4.07%.
For the coming week we are in favour of a retracement in the area of 7,100-7,200.
Indicators
Very positive week for the British index which brings back the price close to the strong resistance at 7,400.
We can see that the price ended the week just below the 200-day moving average (blue line) and we don't believe there is strength and conditions needed to move further up.
MACD and RSI are now very extended to the upside with the latter in overbought territory: looking at previous price action, this extension makes us lean towards a short-term bearish scenario.
|
Current price |
Forecast |
S1 |
R1 |
S2 |
R2 |
|---|---|---|---|---|---|
|
7,334 |
Bearish |
7,000 |
7,400 |
6,850 |
7,600 |
In addition, we believe that the exit from the Bollinger Bands is a further element of caution and a sign of a price that is now very extended to the upside and with high downside potential.
We are bearish on the FTSE 100 and await substantial declines before considering long setups.
Support at 7,000.
Resistance at 7,400.
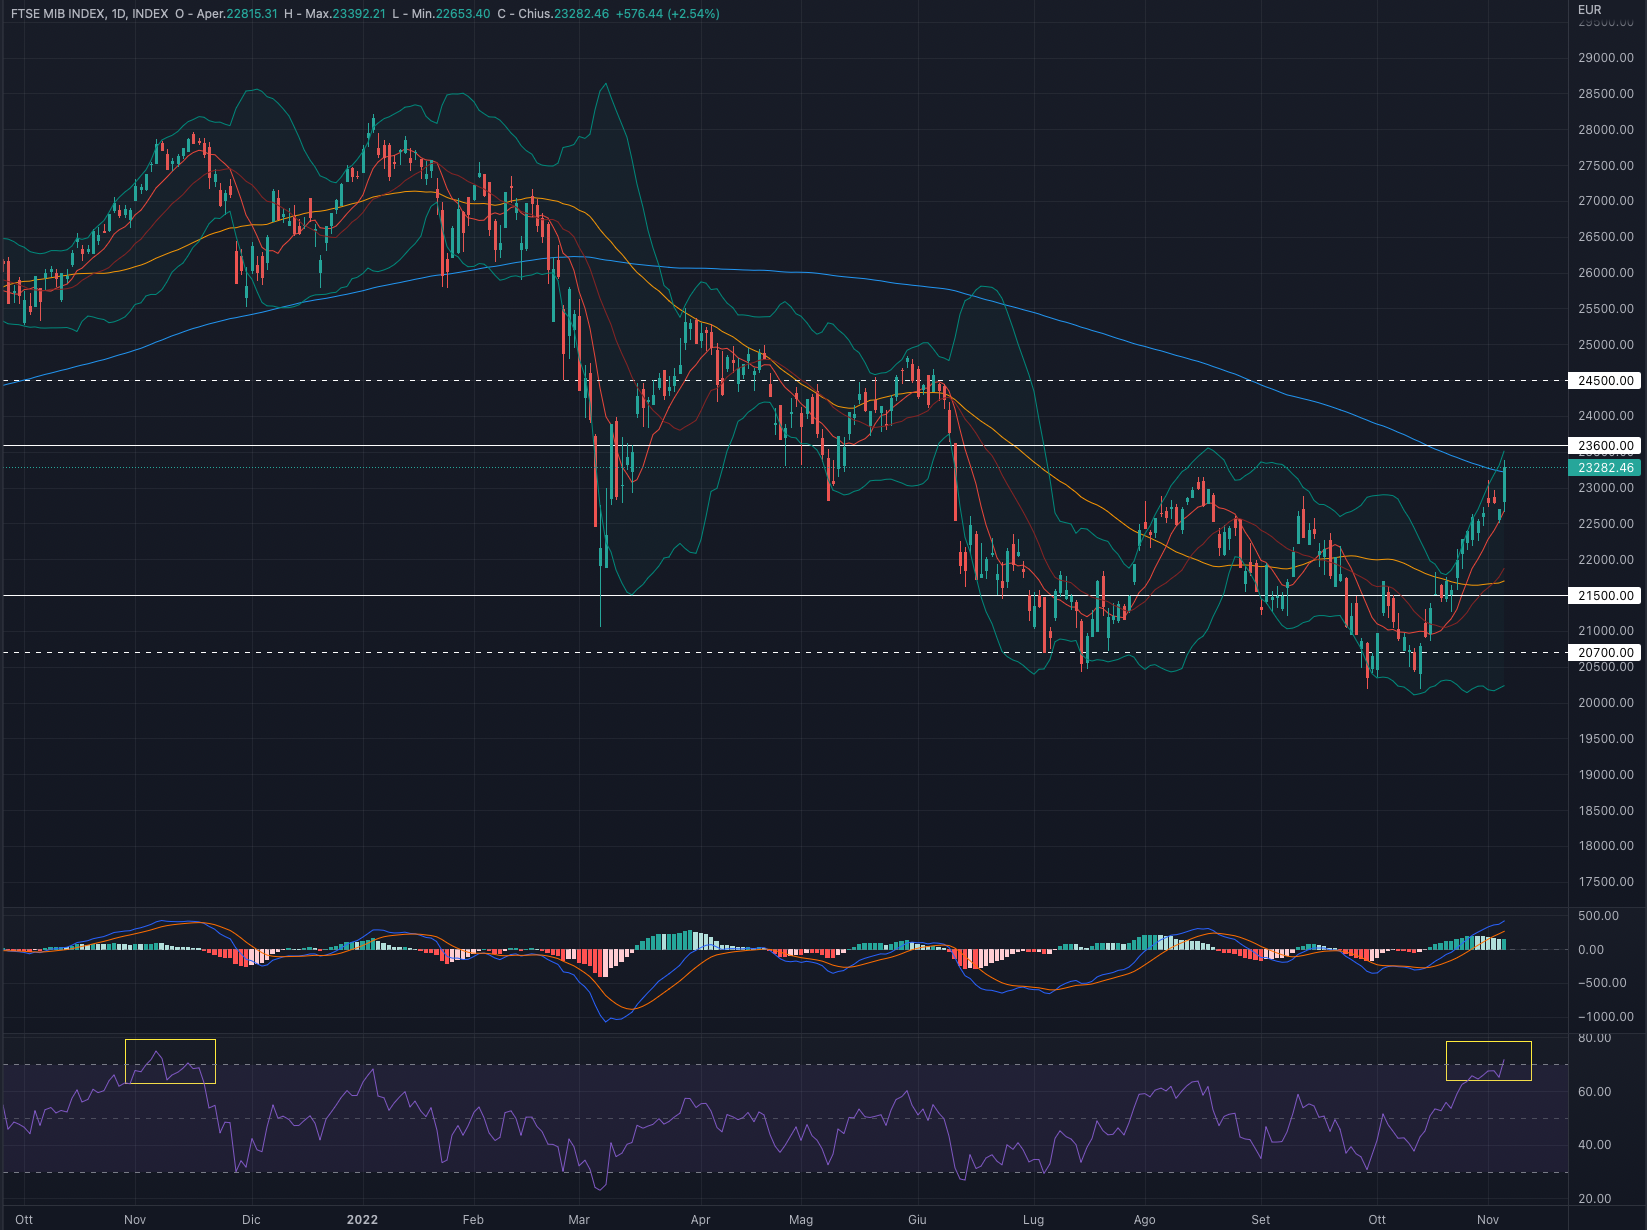
FTSEMIB (FTSEMIB)
The FTSEMIB index had a week up by + 3.34%.
For the coming week we are in favour of consolidation in the area of 22,300
Indicators
A very positive week for the FTSEMIB which brings the Italian index close to the 200-day moving average (blue line) and strong resistance at 23,600.
If in the medium to long term this price action is certainly positive, in the short term we believe that now the price is very extended to the upside and that it may need significant reversals before keep proceeding upward.
|
Current price |
Forecast |
S1 |
R1 |
S2 |
R2 |
|---|---|---|---|---|---|
|
23,282 |
Bearish |
21,500 |
23,600 |
20,700 |
24,500 |
MACD and RSI are now as well very extended to the upside with the latter in overbought territory (a scenario that has not happened since November 2021).
We are bearish on the FTSEMIB as we believe price swing and internal indicators are now overbought, shifting the weight in favour of pulls back rather than further stretches.
An initial close below the 9-day moving average (red line) could pave the way for short-term downside.
Support at 21,500.
Resistance at 23,600.
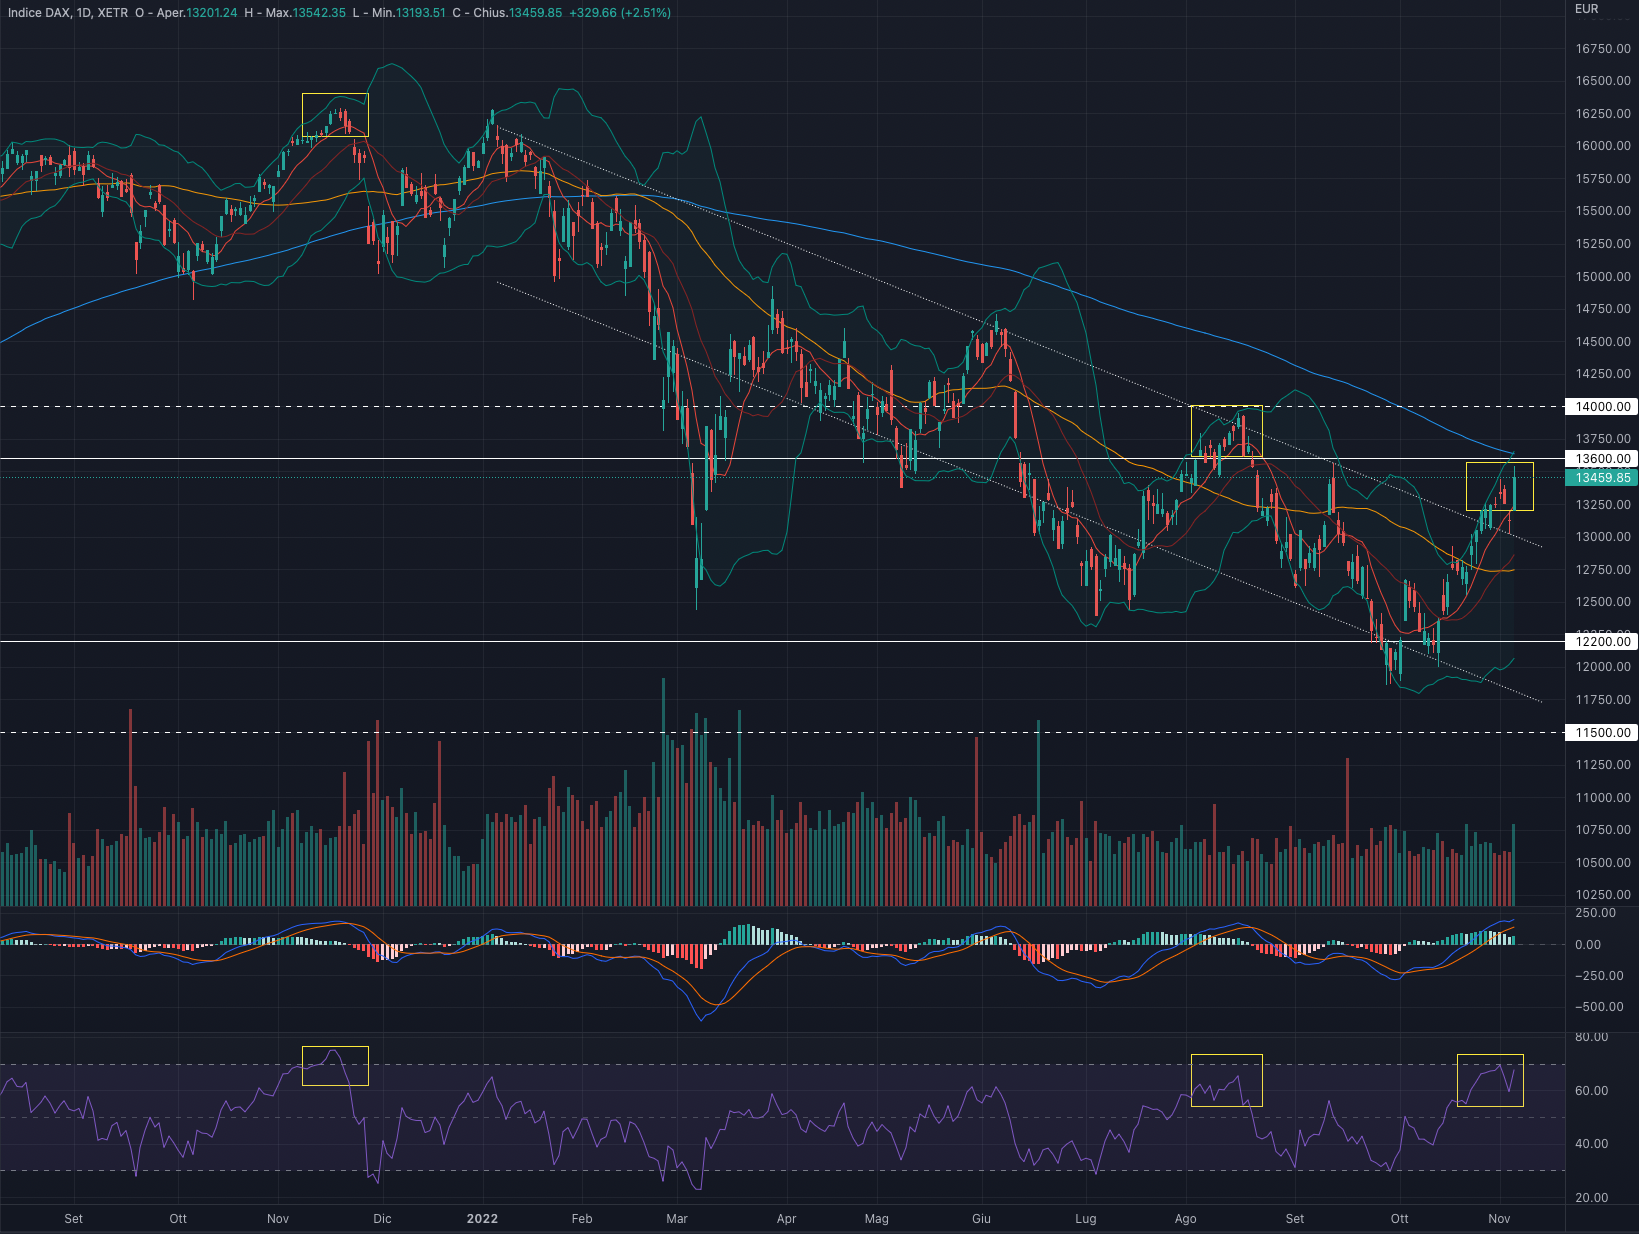
DAX 40 (DAX)
The DAX index had a week up by + 1.63%.
For the coming week we are in favour of consolidation in the area of 12,800.
Indicators
Positive week for the German index which substantially consolidates the rises of the past few weeks.
The price is now close to the 200-day moving average (blue line) and we believe the conditions are not in place to support further rising.
Despite a positive increase in volumes, MACD and RSI are now very extended to the upside with the latter in the overbought area (and slight negative divergence with the price).
|
Current price |
Forecast |
S1 |
R1 |
S2 |
R2 |
|---|---|---|---|---|---|
|
13,459 |
Bearish |
12,200 |
13,600 |
11,500 |
14,000 |
The wide trading range 12,200-13,600 continues to be respected since June 2022 and it is desirable to expect a price retracement.
We are bearish on the DAX and in favour of possible short-term weakness.
Support at 12,200.
Resistance at 13,600.
S&P 500 (SPX)
The S&P500 index had a week down by -3.35%.
For the coming week we are in favour of a possible consolidation in the area of 3,7000.
Indicators
Negative week for the US index which brings back the price close to the narrow September-October's trading range.
The overall scenario is of strong indecision as we have a consolidating price but internal indicators that are alluding to possible declines: MACD is close to a bearish crossover and the RSI continues to remain below 50.
|
Current price |
Forecast |
S1 |
R1 |
S2 |
R2 |
|---|---|---|---|---|---|
|
3,770 |
Cons./ Bearish |
3,550 |
3,900 |
3,400 |
4,100 |
We remain neutral on the S&P 500 given the uncertain scenario: to see sustainable rises we must first have an alignment between internal indicators and price action.
Support at 3,550.
Resistance at 3,900.

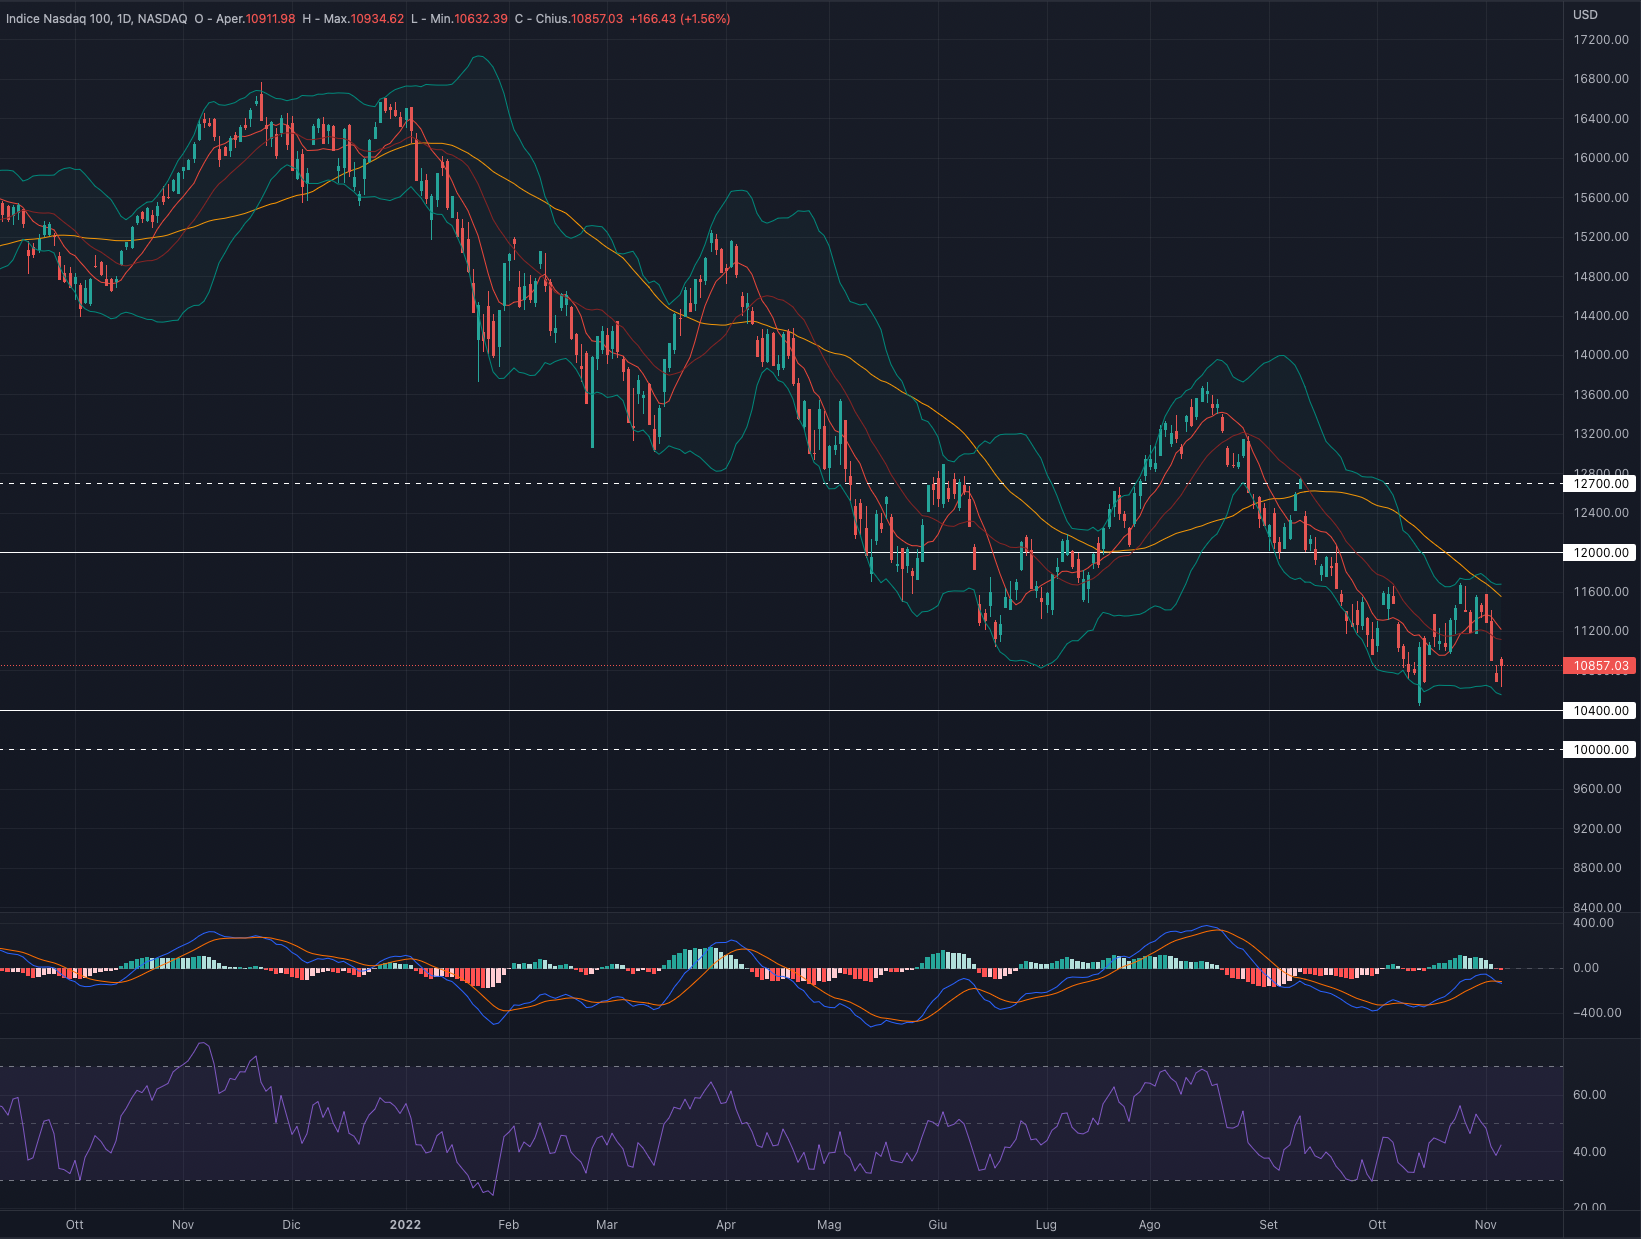
Nasdaq 100 (NDX)
The NASDAQ 100 index had a week down by -5.97%.
For the coming week we are in favour of a consolidation in the area of 10,600 - 11,000.
Indicators
Week of significant falls for the Tech index which brings the price back to the lows of September 2022. The 50-day moving average (yellow line) continues to be a strong dynamic resistance that continuously blocks attempts to the upside.
MACD and RSI also describe a negative scenario with the first close to a further bearish crossover. At the same time, the RSI is in a slight positive divergence with the price.
|
Current price |
Forecast |
S1 |
R1 |
S2 |
R2 |
|---|---|---|---|---|---|
|
10,857 |
Consolidation |
10,400 |
12,000 |
10,000 |
12,700 |
We remain neutral on the NASDAQ 100, the slope of the moving averages and the negativity of the internal indicators suggest further declines. At the same time, the strong downward extension can give rise to quick changes of direction: it is better to wait for a clearer and more linear overall scenario.
Support at 10,400.
Resistance at 12,000.
Dow Jones (DJI)
The DOW JONES index had a week down by -1.40%.
For the coming week we are in favour of a retracement in the area of 31,500.
Indicators
Negative week that substantially consolidates the price after the strong stretches of the past sessions.
The price is now close to the 200-day moving average and we do not believe the conditions are in place to continue the most recent hikes.
|
Current price |
Forecast |
S1 |
R1 |
S2 |
R2 |
|---|---|---|---|---|---|
|
32,403 |
Cons./ Bearish |
30,170 |
33,250 |
29,170 |
34,150 |
MACD and RSI are quite extended to the upside and looking at past swings the risk / reward is now in favour of a possible reversal rather than a further extension.
At the moment we remain neutral / bearish on the DOW JONES and looking for for the price to retrace to more interesting levels: possibly in the area of 31,000 - 30,500
Support at 30,170.
Resistance at 33,250.

TADAWUL (TASI)
The TADAWUL index had a week down by -2.31 %.
For the coming week we are in favour of a consolidation in the area of SAR 11,800 - 11,400.
Indicators
A week that saw the Saudi index reverse the most recent downward pressure near the support at 11,250
The 50-day moving average (yellow line) continues to represent strong dynamic resistance and only a break of it could pave the way for a stronger upward move.
|
Current price |
Forecast |
S1 |
R1 |
S2 |
R2 |
|---|---|---|---|---|---|
|
11,606 |
Cons./ Bearish |
11,250 |
12,270 |
10,900 |
12,650 |
MACD and RSI are both recovering, leaning towards a possible revival of vigour.
At the moment we prefer to remain neutral on the Tadawul to understand if the price will manage to close above 11,800
Support at 11,250.
Resistance at 12,270.

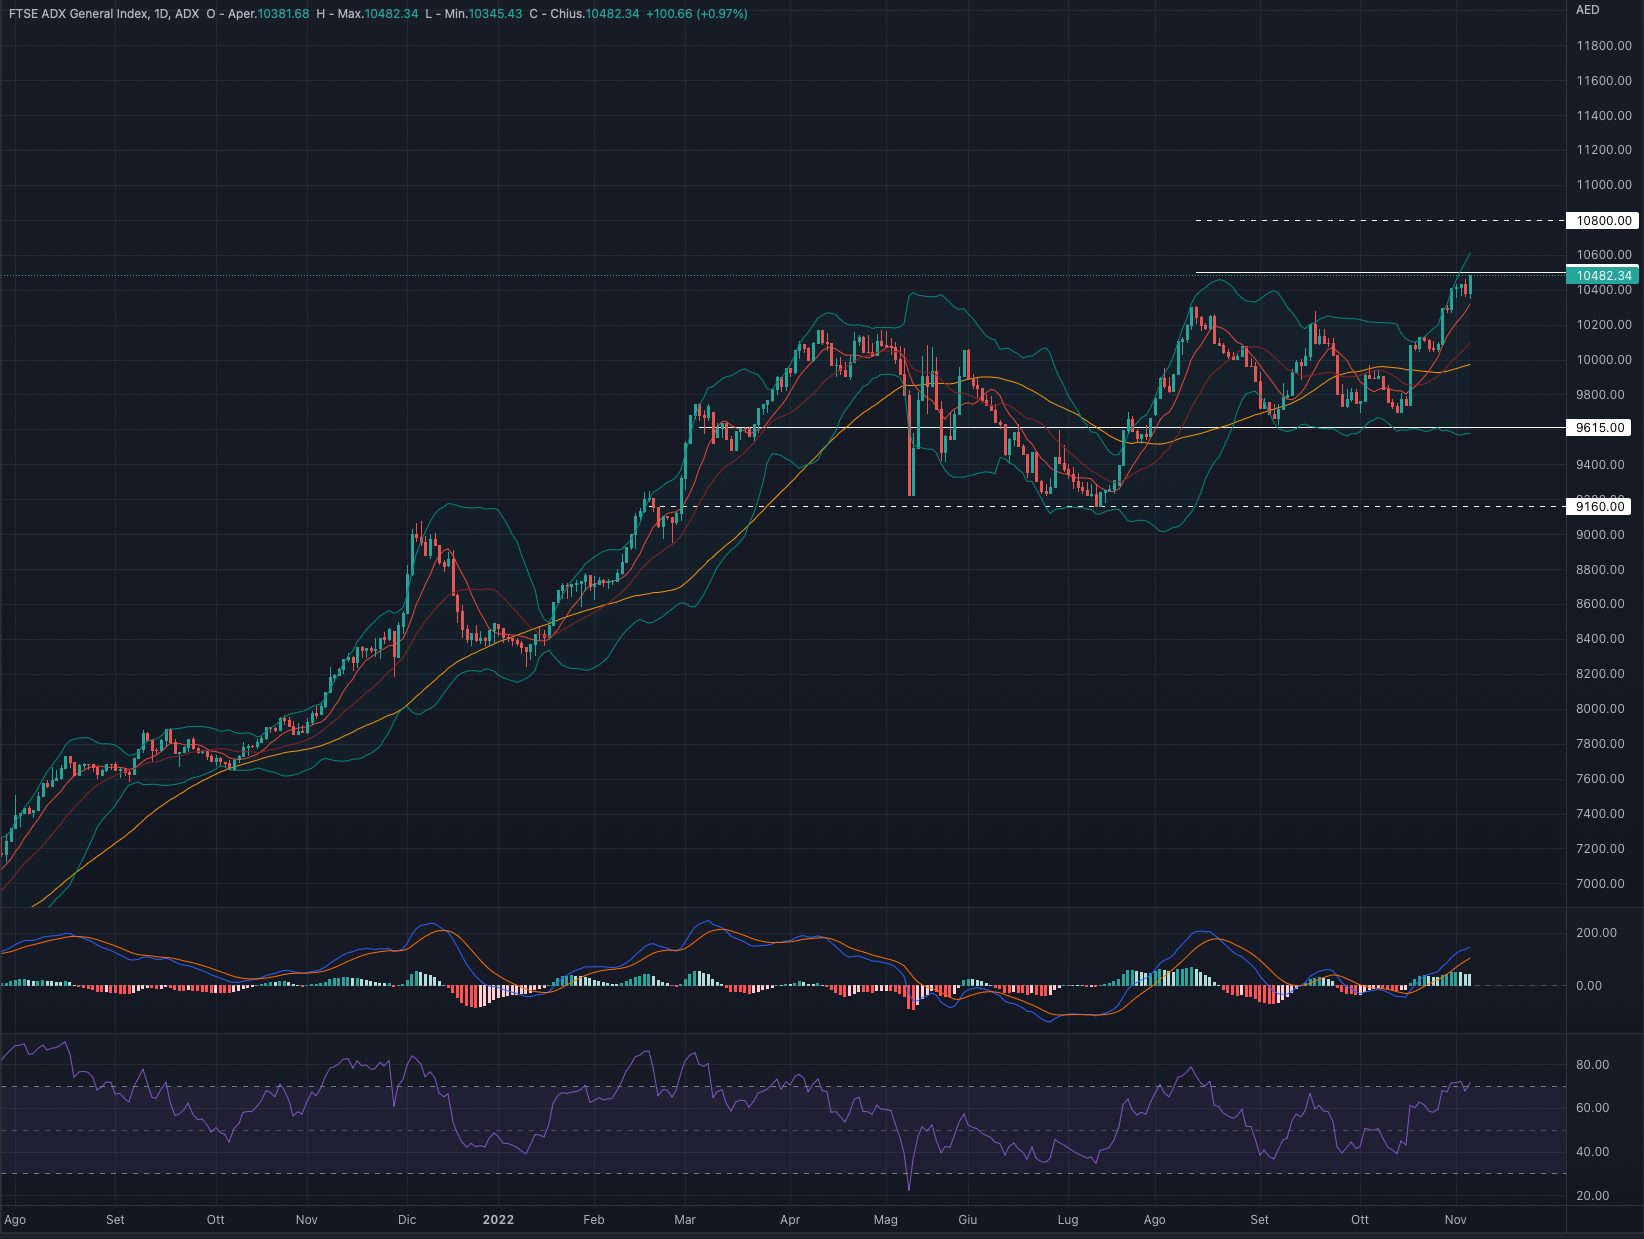
FTSE ADX GROWTH MARKET INDEX (FADGI)
The FTSE ADX index had a week up by + 1.90%.
For the coming week we are in favour of a consolidation in the area of 10,200.
Indicators
Positive week for the ADX which sees the price reaching all-time highs
MACD and RSI are now very extended to the upside shifting the risk / reward in favour of possible downward pressure rather than further upside.
|
Current price |
Forecast |
S1 |
R1 |
S2 |
R2 |
|---|---|---|---|---|---|
|
10,482 |
Cons./ Bearish |
9,615 |
10,500 |
9,160 |
10,500 |
At the moment we prefer to remain neutral on the FTSE ADX, the strong upward extension is positive in the medium to long term. At the same time, before consider long setups, we believe it is appropriate to wait for the price to stabilise.
Support at 9,615.
Resistance at 10,500.
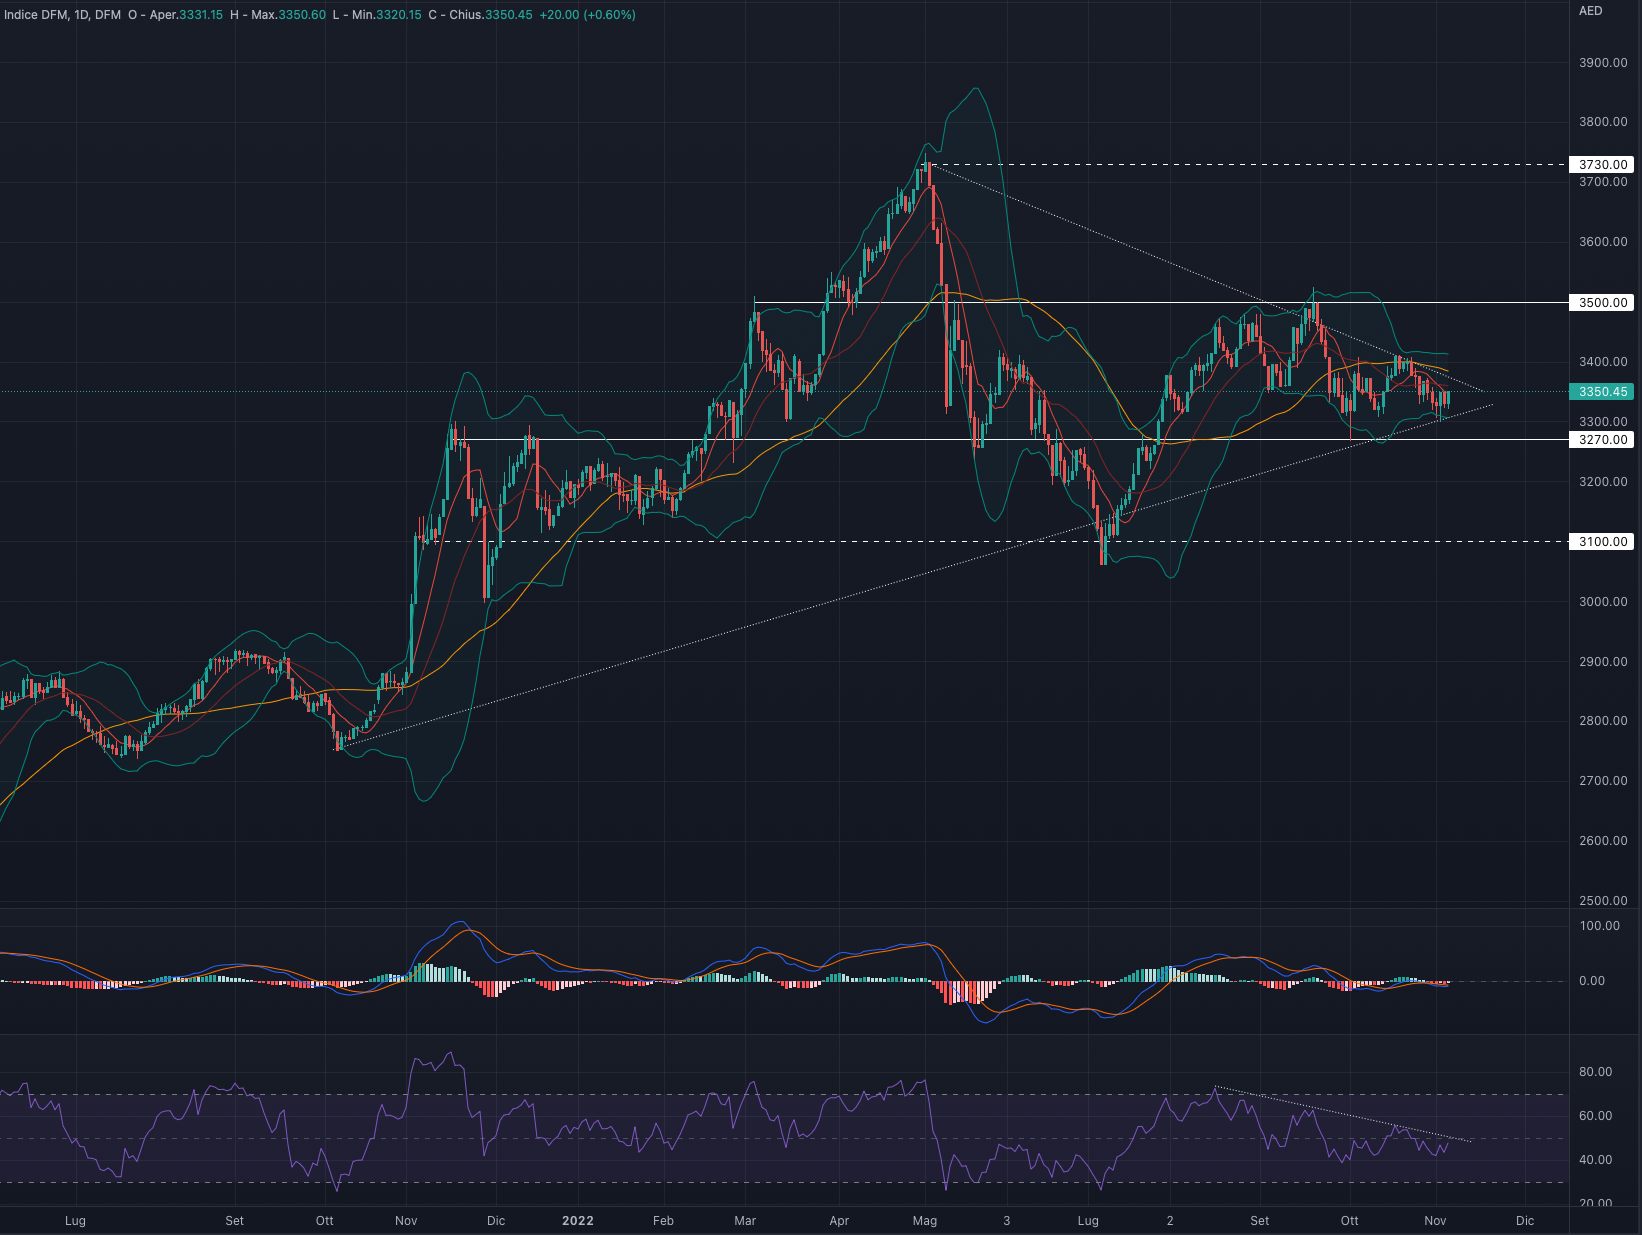
DUBAI FINANCIAL MARKET GENERAL INDEX (DFMGI)
The DFM index had a week up by + 0.03%.
For the coming week we are in favour of a consolidation in the area of AED 3,350 - 3,300.
Indicators
A week of consolidation that continues to keep the price below the 50-day moving average (yellow line): if on the one hand a break of it could give rise to upward pressure, a drop in the price below 3,300 could lead to new bearish volatility.
|
Current price |
Forecast |
S1 |
R1 |
S2 |
R2 |
|---|---|---|---|---|---|
|
3,350 |
Consolidation |
3,270 |
3,500 |
10,900 |
12,650 |
MACD and RSI describe a neutral and directionless scenario.
We remain neutral on the DFM and awaiting better directionality: thanks to the trend lines drawn from May 2022 and October 2021 we can in fact note that the price is in sharp contraction.
Upon breaking of one of the two trendlines, we expect strong volatility in both directions.
Support at 3,270.
Resistance at 3,500.
Author

Francesco Bergamini
OTB Global Investments
Francesco, BSc Finance and Msc in Business Management, graduated with Merit, is a professional with experience in the financial services industry and a keen interest in the financial markets.


