We can only hope for this shutdown to end sooner as opposed to later

USD: Dec '25 is Down at 98.350.
Energies: Dec '25 Crude is Up at 58.10.
Financials: The Dec '25 30 Year T-Bond is Higher by 12 ticks and trading at 118.11.
Indices: The Dec '25 S&P 500 emini ES contract is 96 ticks Higher and trading at 6739.00.
Gold: The Dec'25 Gold contract is trading Up at 4253.50.
Initial conclusion
This is not a correlated market. The USD is Down and Crude is Up which is normal, and the 30 Year T-Bond is trading Higher. The Financials should always correlate with the US dollar such that if the dollar is Higher, then the bonds should follow and vice-versa. The S&P is Higher and Crude is trading Higher which is not correlated. Gold is trading Higher which is correlated with the US dollar trading Down. I tend to believe that Gold has an inverse relationship with the US Dollar as when the US Dollar is down, Gold tends to rise in value and vice-versa. Think of it as a seesaw, when one is up the other should be down. I point this out to you to make you aware that when we don't have a correlated market, it means something is wrong. As traders you need to be aware of this and proceed with your eyes wide open. All of Asia traded Higher except the Hang Seng exchange. Currently all of Europe is trading Higher except the London exchange.
Possible challenges to traders
- Philly Fed MFG Index is out at 8:30 AM EST. Major.
- FOMC Members Waller Barr and Miran Speak at 9 AM EST. Major.
- FOMC Member Bowman Speaks at 10 PM EST. Major.
- FOMC Member Waller Speaks at 1 PM EST. Major.
- NAHB Housing Market Index is out at 10 AM EST. Major.
- Business Inventories is tentative. Major.
- Natural Gas Storage is out at 10:30 AM EST. Major.
- Crude oil Inventories is out at 12 noon EST. Major.
Traders, please note that we've changed the Bond instrument from the 10 Year (ZN) to the 2 Year (ZT). They work exactly the same.
We've elected to switch gears a bit and show correlation between the 2-year Treasury notes (ZT) and the S&P futures contract. The YM contract is the Dow Jones Industrial Average, and the purpose is to show reverse correlation between the two instruments. Remember it's likened to a seesaw, when up goes up the other should go down and vice versa.
Yesterday the ZT dived Lower at around 8 AM EST with no other economic news in sight. The Dow climbed Higher at the same time. Look at the charts below and you'll see a pattern for both assets. The Dow climbed Higher at around 7:30 AM EST and the ZT dived Lower at around the same time. These charts represent the newest version of Bar Charts, and I've changed the timeframe to a 15-minute chart to display better. This represented a Short opportunity on the 2-year note, as a trader you could have netted about 20 plus ticks per contract on this trade. Each tick is worth $6.25. Please note: the front month for ZT is now Dec '25 and the Dow is now Dec '25. I've changed the format to filled Candlesticks (not hollow) such that it may be more apparent and visible.
Charts courtesy of barCharts
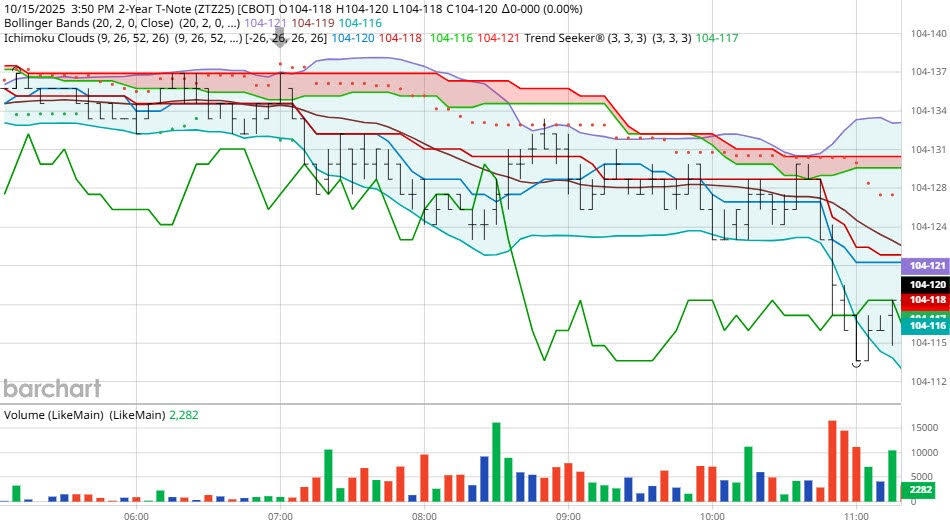
ZT -Sep 25 - 10/15/25
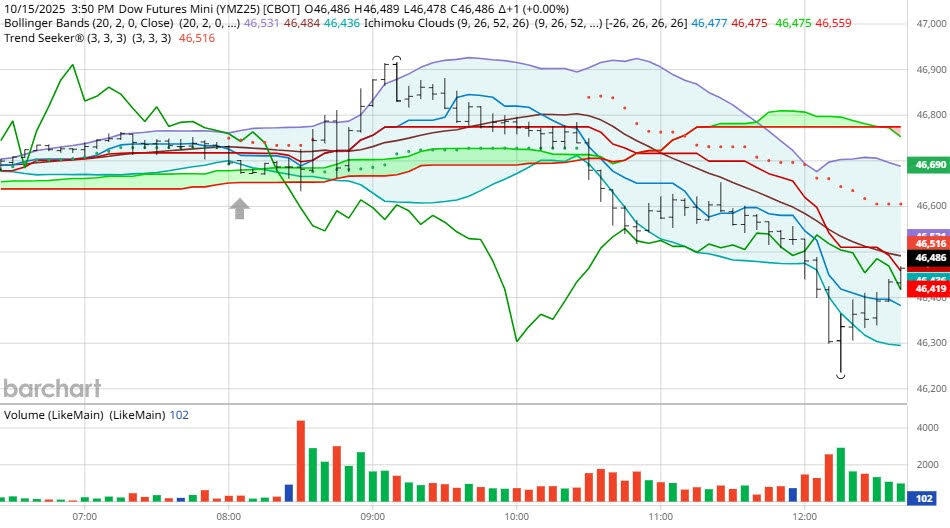
Dow - Sep 2025- 10/15/25
Bias
Yesterday we gave the markets an Upside bias, and for the most part the markets did veer Higher. The Dow faltered at the end of the session and dropped 17 points, but the other indices gained ground on the session. Today we aren't dealing with a correlated market, and our bias is Neutral or Mixed.
Could this change? Of Course. Remember anything can happen in a volatile market.
Commentary
Another lopsided day in the markets with a Mixed finish. It seems that since this shutdown started we do not have any sense of stability in these markets. Will this change? We can only hope for this shutdown to end sooner as opposed to later.
Author

Nick Mastrandrea
Market Tea Leaves


