W.D. Gann Square suggests Dow Jones Index Market Bottom? Financial Astrology forces says No!

It comes to my attention when one of my students submit the following homework for attending our WD Gann Investment to Implementation Course. The following charts is Dow Jones Index, and that it looks like it is doing a nice W.D. Gann Price Squaring bottom at the market.
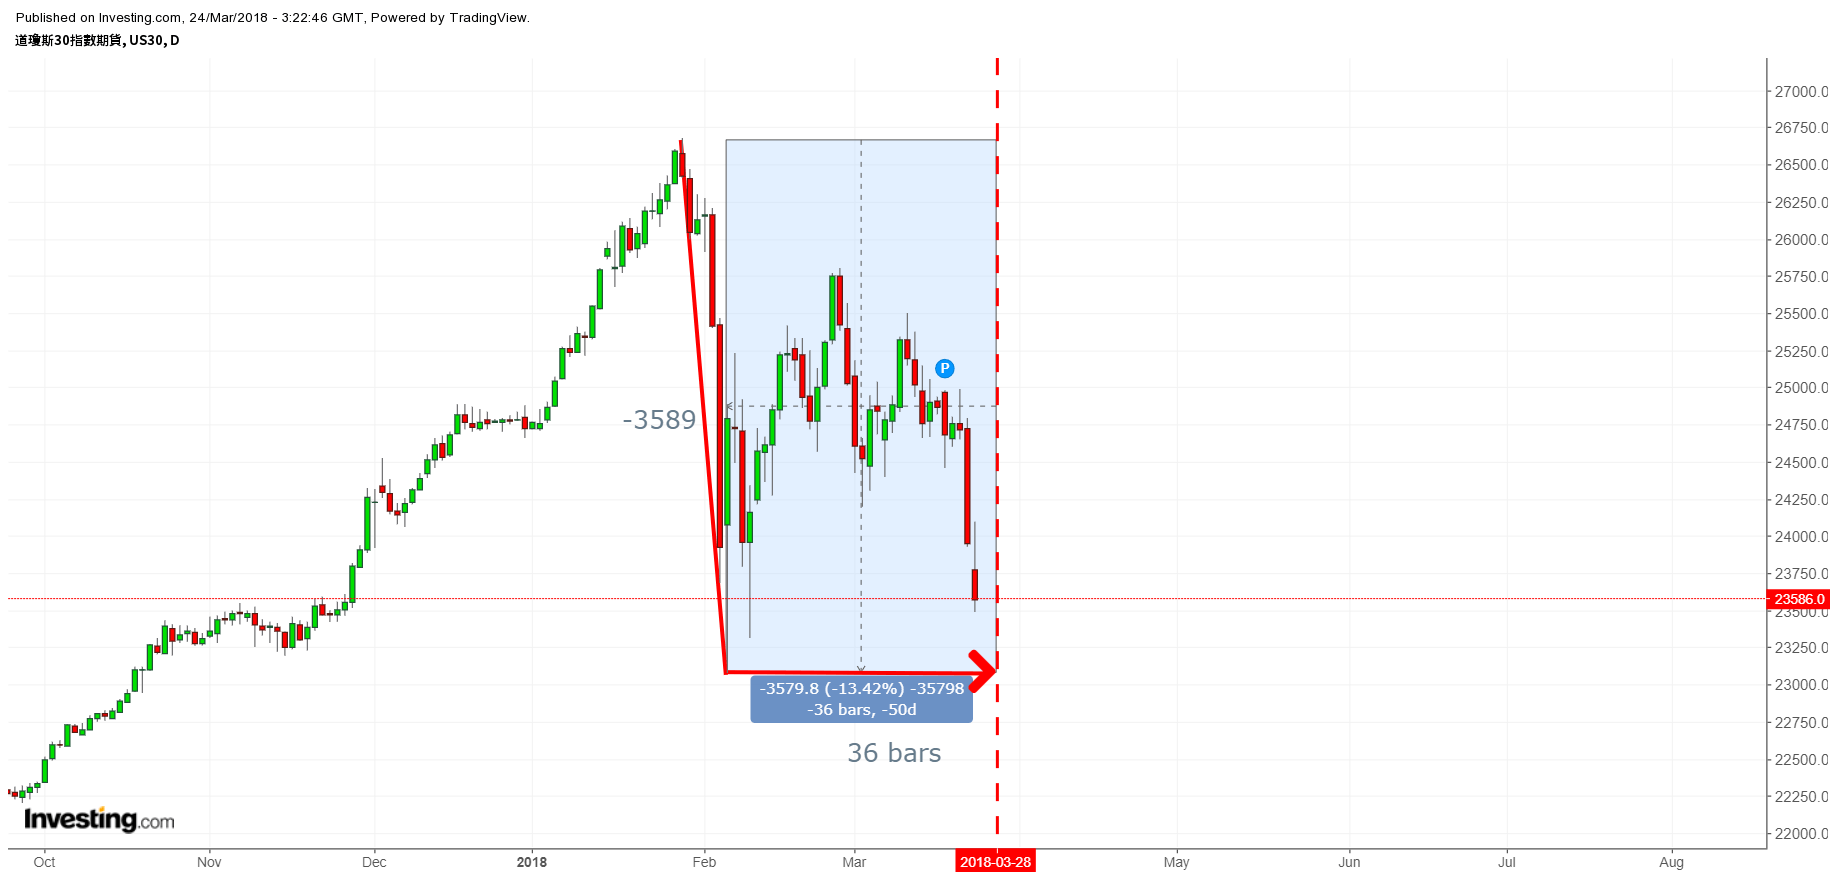
But one thing strike me that a normal Bull market does not do something like the following.
It is each giant tech US stocks are having issues on their own.
TSLA – issue with auto driving
FB – data privacy issue
AMZN – Trump might want more tax on this monopoly market
It seems that there are underlying (astrology) forces to give totally different troubles to these giant companies at the same time. Which usually only happen in bear market.
And that, in fact, we are in a very critical time now. Levels like 29,000 on Hang Seng Index, 2,530 on S&P, 23,400 should be closely watched if it able to provide support to the markets.
Shall these levels are being broken, a further decline in the market will come until 17th May 2018. Which 17th May 2018 should be regarded as a major turn in Q2.
Khit
Trineaspect.com and Khit Wong are not responsible for any profit or loss on actions taken on the comments shared in FXStreet.com. While the comments do not suggest nor imply in any way for any trade decisions for the readers, they are all for educational purposes.
Author

Khit Wong
Gann Explained
As a noted expert on FXStreet.com and in “Technical Analysis of Stocks & Commodities” and "Traders World," I specialize in applying W.D. Gann's complex theories to practical trading.


