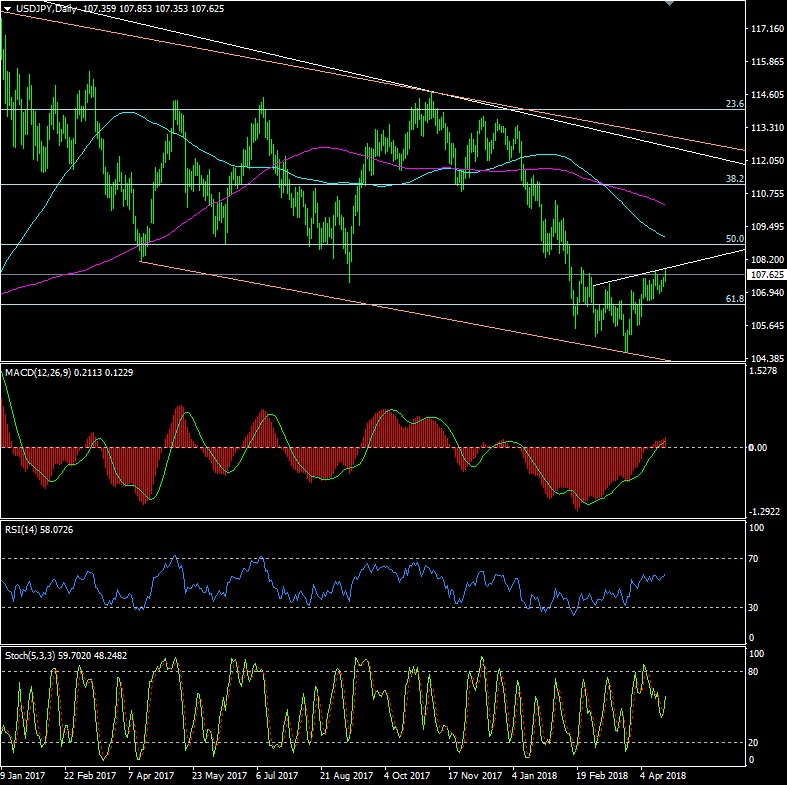
USDJPY: The daily momentum indicators retain a mildly constructive bias

US$Jpy headed up to 107.84 on Friday before reversing a little lower into the week’s close, to finish at 107.62. Overall, the pair remains firm despite the weaker equities markets on Friday, but with the dollar firmly underpinned by rising US Treasury yields. BOJ due Friday; No change expected.
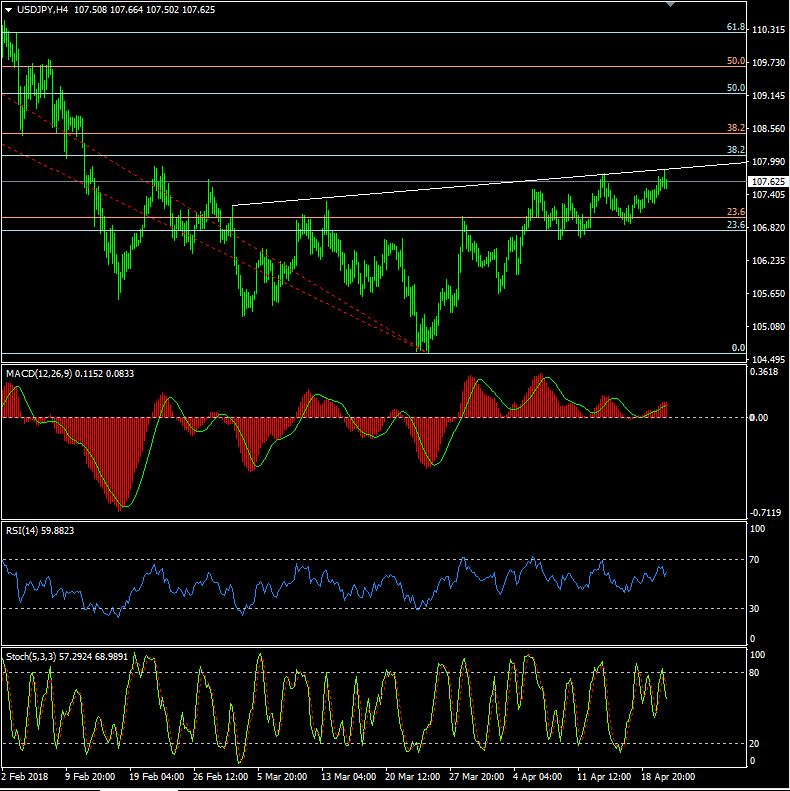
1 hour/4 hour indicators: Mixed.
Daily Indicators: Turning higher?
Weekly Indicators: Turning higher
referred Strategy: As before, the daily momentum indicators retain a mildly constructive bias and look as though they are building up for another move higher. The weeklies are also turning up so sentiment does look to be improving for US$Jpy although the short term charts look neutral on Monday and a fairly neutral stance is again required, but technically, buying dips still seems to be the plan.
On the topside, back above the Friday high of 107.84, would find offers nearby, at 107.90 (21 Feb high) above which, 108.05/10 would then be a target. A break of this would allow a run to 108.45/50 and then to 109.80 although this remains some way off.
On the downside, buyers will be seen at 107.50 (minor), at 107.35 and at 107.15/20 ahead of 107.00. Below there would open up the 17 Apr low at 106.87 ahead of good support at 106.55/65. Below here could see a reverse towards 106.20, 106.00, and possibly towards the 3 April low of 105.68 although this seems unlikely right now.
Note the possibility of a reverse SHS formation with the neckline at Friday’s high. A positive topside break would target somewhere near 110.70.
As before, if stocks turn sharply lower again, potentially taking US$Jpy along for the ride despite the currently positive medium term indicators, a move back below the 200 MMA (105.60) would open the way to 105.30, a break of which would allow a return to 104.60. Below that, there is little to support the dollar until 103.50 – This currently looks well beyond the horizon, and overall, while the dailies remain positive, I prefer to be trading from the long side and looking to buy dips.
Buy US$Jpy @ 107.40. SL @ 106.85, TP @ 108.45

Economic data highlights will include:
M: Nikkei Flash Mfg PMI
T: All Industry Activity Index
W:
T:
F: Tokyo CPI, Industrial Production, Retail Sales, BOJ Meeting/Interest Rate Decision/Statement/Outlook
Author

Jim Langlands
FX Charts
Jim Langlands began his trading career in the commodities markets in London in 1976, before moving to Australia in 1979 to work as a floor trader on the Sydney Futures Exchange.


