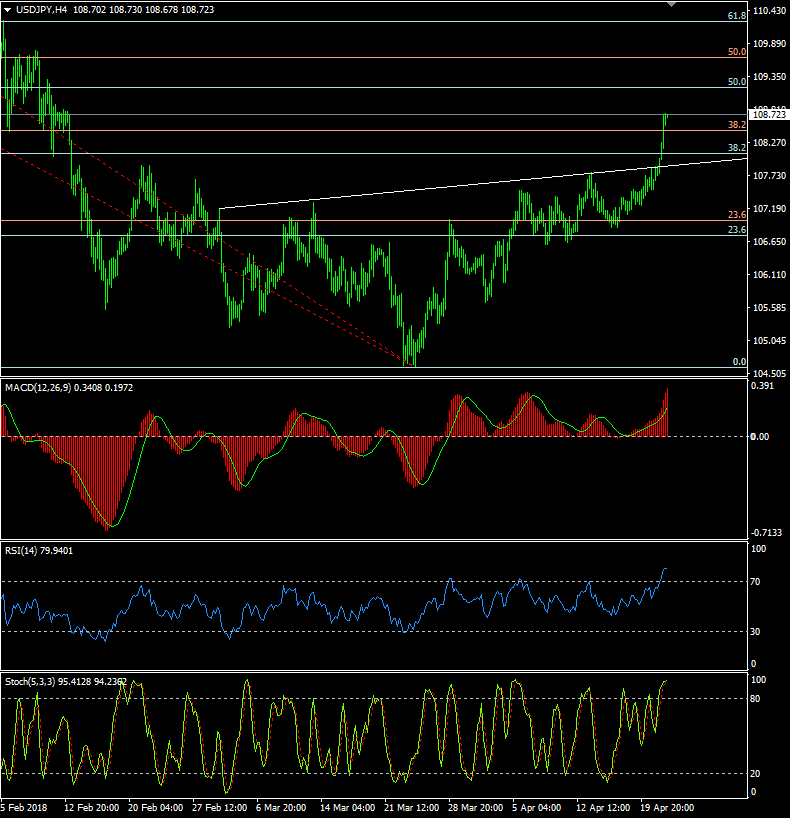
USDJPY: The 4 hour charts now also looking very positive

US$Jpy headed up to 108.75 on Monday, closing nearby and with the dollar firmly underpinned by the rising US Treasury yields.
1 hour/4 hour indicators: Mixed.
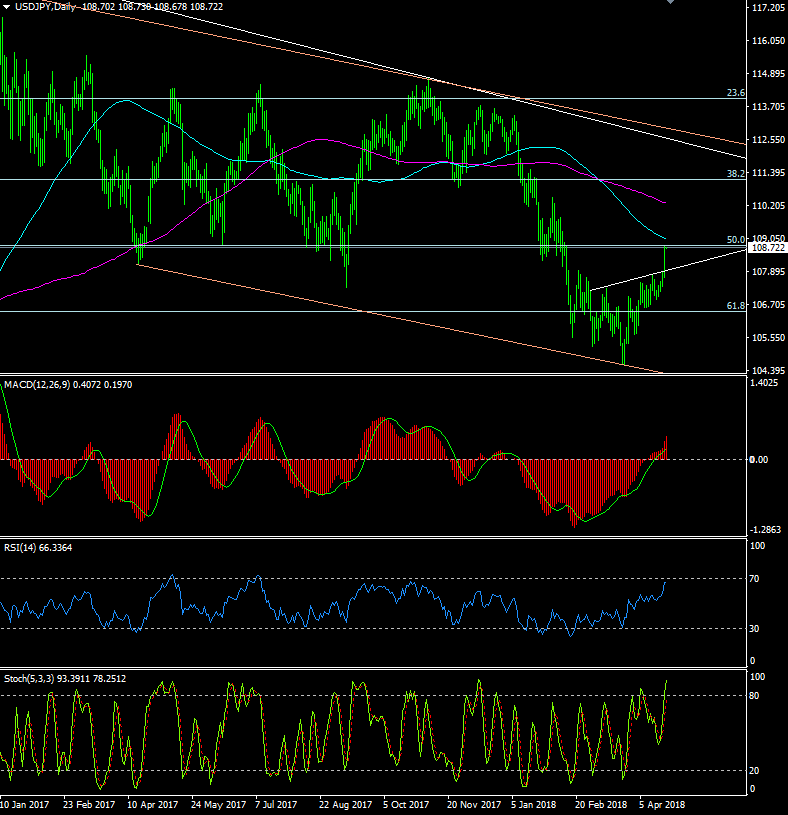
Daily Indicators: Turning higher?
Weekly Indicators: Turning higher
Preferred Strategy: As before, the daily momentum indicators retain a constructive bias and seem set to head higher still, with the 4 hour charts now also looking very positive. The weeklies are also turning higher and sentiment does appear to be accelerating so buying dips still seems to be the plan.
On the topside, back above the session high of 108.75, would find offers 109.00/05, at 109.15 and at 109.65 although this remains some way off. As we said yesterday, note the reverse SHS formation, with the neckline at 107.85, which has now been broken and suggests a target at somewhere near 110.70.
On the downside, buyers will be seen at 108.50 (minor), at 108.25 and at 108.00 ahead of the neckline (107.85) and the session low at 107.65. This looks unlikely to be seen again today though and trading from the long side is again preferred.
Buy US$Jpy @ 108.20. SL @ 107.60, TP @ 110.50

Economic data highlights will include:
All Industry Activity Index
W:
T:
F: Tokyo CPI, Industrial Production, Retail Sales, BOJ Meeting/Interest Rate Decision/Statement/Outlook
Author

Jim Langlands
FX Charts
Jim Langlands began his trading career in the commodities markets in London in 1976, before moving to Australia in 1979 to work as a floor trader on the Sydney Futures Exchange.


