USD/JPY lacks bullish motives, EUR/CAD builds uptrend [Video]
![USD/JPY lacks bullish motives, EUR/CAD builds uptrend [Video]](https://editorial.fxstreet.com/images/Markets/Currencies/Majors/USDJPY/japanese-currency-16048717_XtraLarge.jpg)
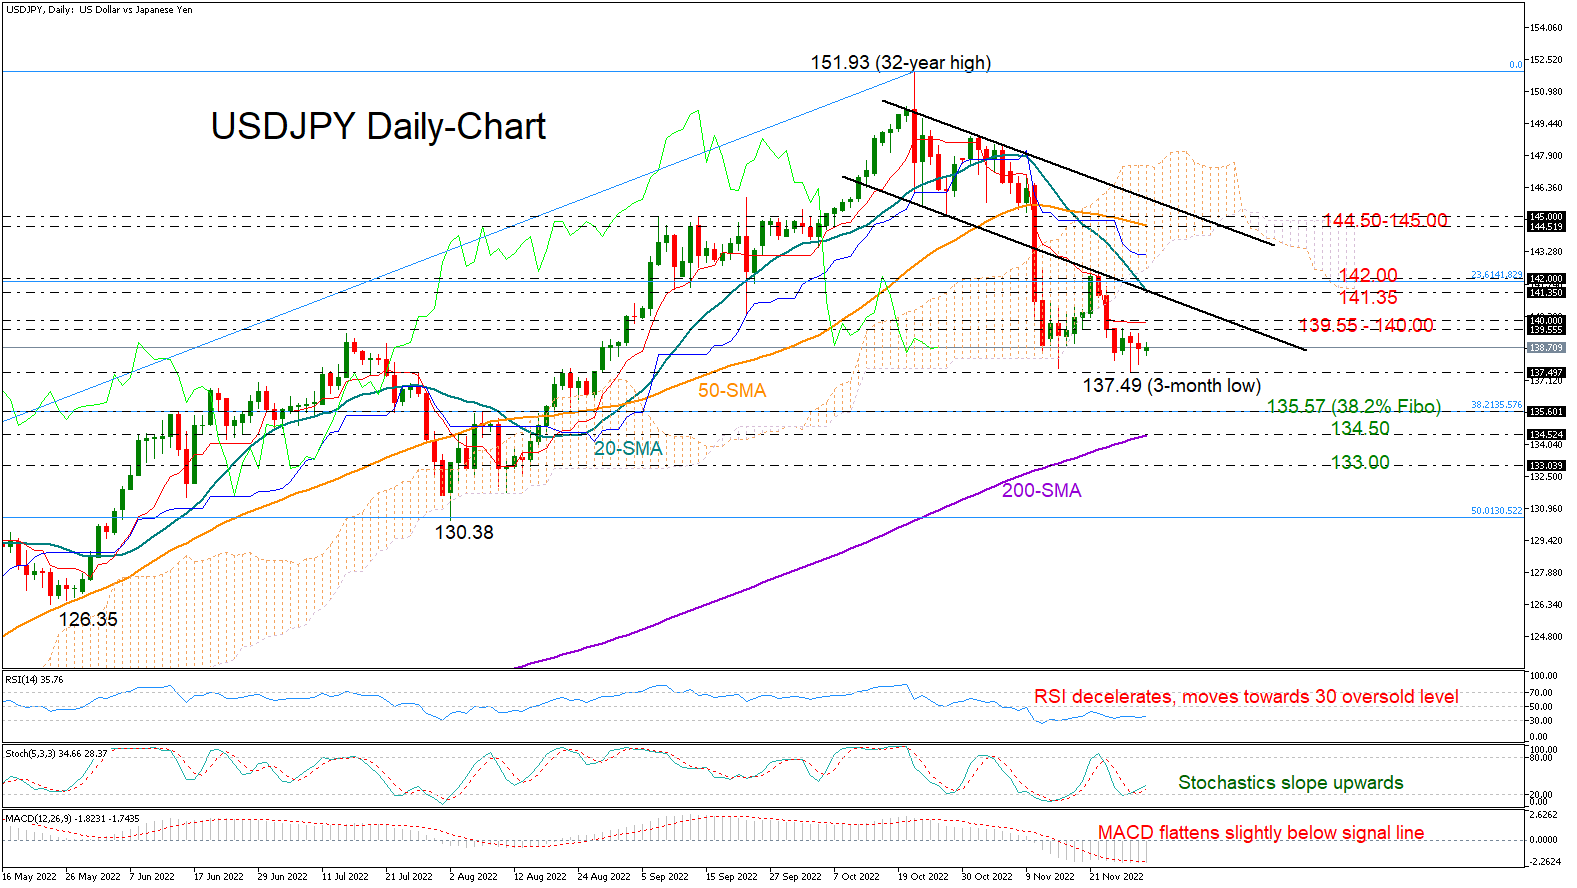
USD/JPY lacks bullish motives near November’s low
USDJPY shifted to the sidelines following last week’s aggressive downfall from the 142.00 area, consolidating its losses between 139.55 and 137.49.
Even though the pair is searching for a foothold near November’s low of 137.49, the technical signals have yet to identify strong buying motives. Particularly, the RSI has been struggling to gain ground following the exit from the oversold territory, while the MACD has been flattening slightly below its red signal line and within the negative area.
If selling pressures resurface below November’s trough, all eyes will turn to the 38.2% Fibonacci retracement of the 109.10-151.93 uptrend at 135.57. However, the 200-day simple moving average (SMA), which hasn't been tested since February 2021, could be a more important barrier at 134.50. A decisive close below it could confirm additional losses towards the 133.00 round level.
On the upside, a break above 140.00 is required to boost the price towards the 20-day SMA at 141.35. The channel’s lower boundary is in the same area, while the 23.6% Fibonacci of 141.89 is also within breathing distance. Should the pair re-enter the 142.00 zone, the recovery may speed up to the 50-day SMA at 144.57.
All in all, the ongoing sideways move in USDJPY remains exposed to a breakdown. A step below 137.49 could trigger the next bearish phase in the market.
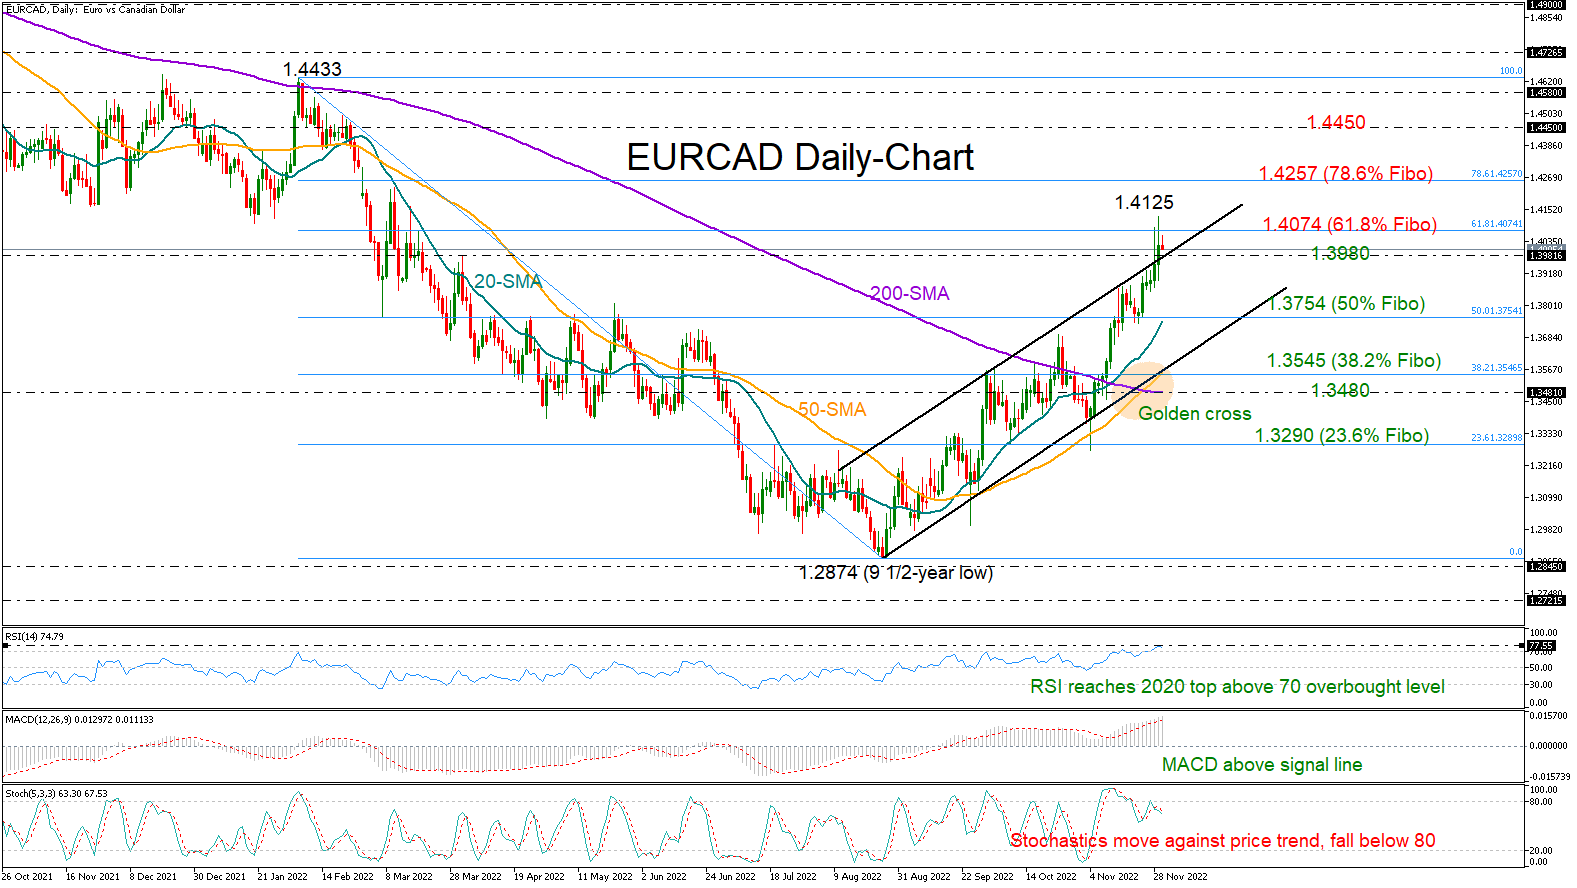
EUR/CAD builds uptrend, overbought signals strengthen
EURCAD has rallied by almost 10% since the plunge to a nine-and-a-half year low of 1.2874 in August, retracing more than half of its 2022 downtrend.
On Tuesday the price accelerated above a bullish channel to mark a new higher high at 1.4125, but it soon lost momentum to close below the 61.8% Fibonacci retracement of the 2022 downtrend.
With the stochastics showing bearish divergence and the RSI having reached its 2020 top in the overbought territory, a downside correction looks increasingly likely. That said, the golden cross between the 50- and 200-day simple moving averages (SMAs), which is the first posted since 2020, suggests that a potential downside correction might be part of the ongoing uptrend.
A sustainable move above 1.4074 could reduce negative risks, prompting an advance towards the 78.6% Fibonacci of 1.4257. Running higher, the bulls will need to overcome the 1.4450 bar to secure an extension up to the 2022 high of 1.4433.
Alternatively, a move back into the channel (1.3980) may dampen market sentiment, bringing the 20-day simple moving average (SMA) and the 50% Fibonacci of 1.3754 next into view. Even lower, the bears will push for a break below the channel at 1.3545. This is where the 50-day SMA and the 38.2% Fibonacci are placed too. Hence, failure to pivot here, and more importantly around the 200-day SMA at 1.3480, could see the price diving straight to the 23.6% Fibonacci of 1.3290.
In brief, EURCAD is trading bullish, but some caution is required as the room for improvement seems to be narrowing according to technical signals.
Author

Christina joined the XM investment research department in May 2017. She holds a master degree in Economics and Business from the Erasmus University Rotterdam with a specialization in International economics.


