USDCAD - Dip buying inside the bullish wedge

Technical
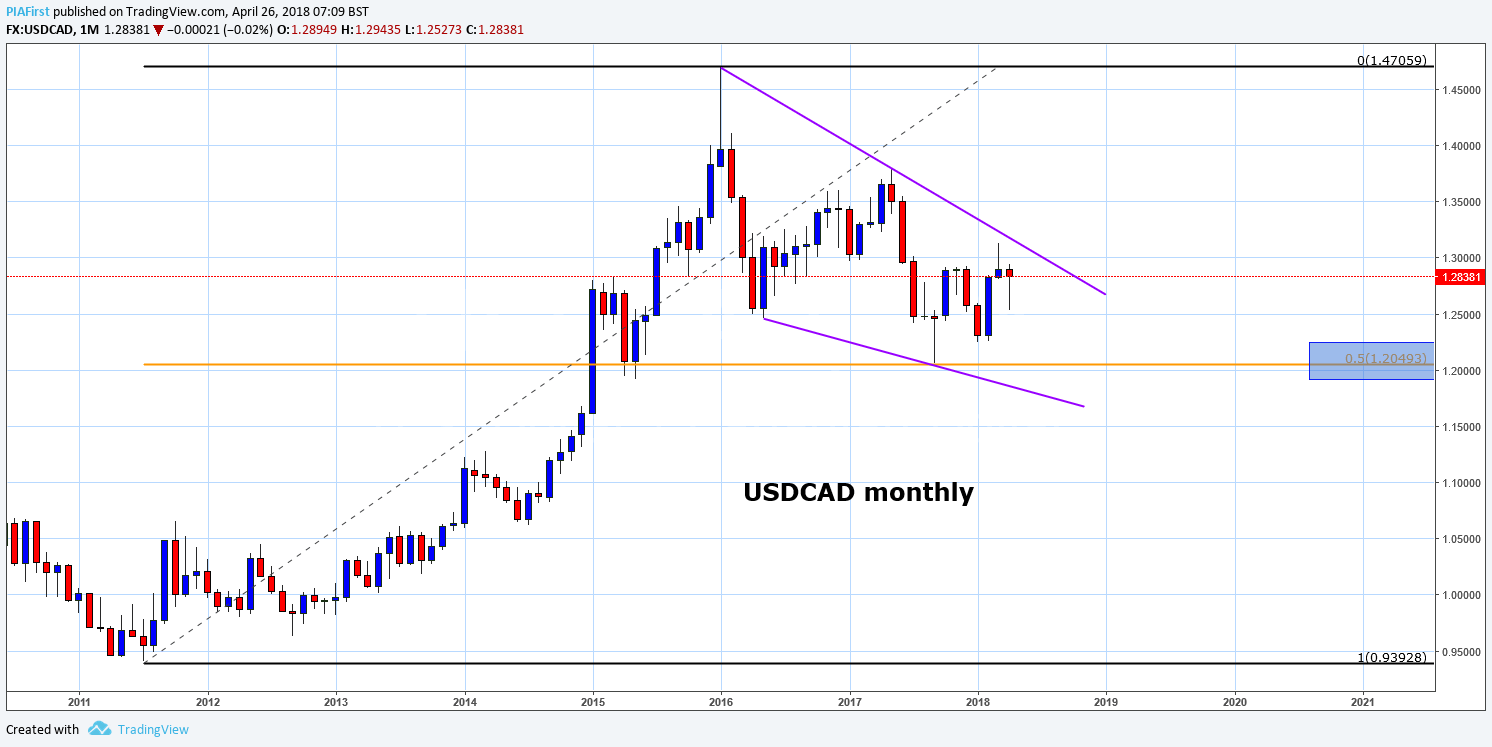
Monthly: We had an impulsive rally from the 2011 low (0.9407) to the 2016 high (of 1.4690). The correction lower found buyers close to the 50% pullback level of 1.2049. Mixed trading for the last 27 months looks to have formed a bullish descending wedge formation.
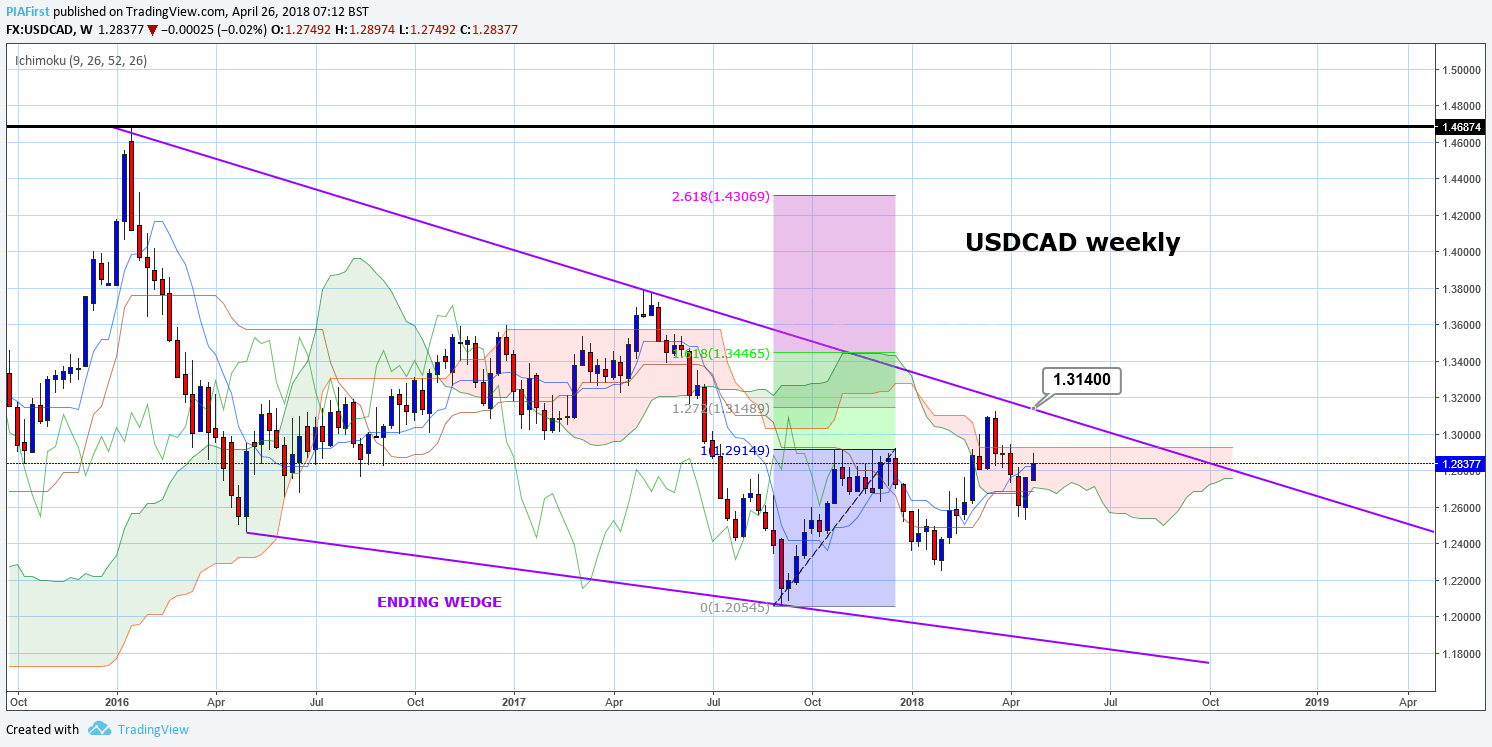
Weekly: The weekly chart highlights the wedge more clearly. The sequence for trading is higher highs and higher lows. A break of 1.3140 (lower highs) and the measured move target is the start of the wedge formation at 1.4690
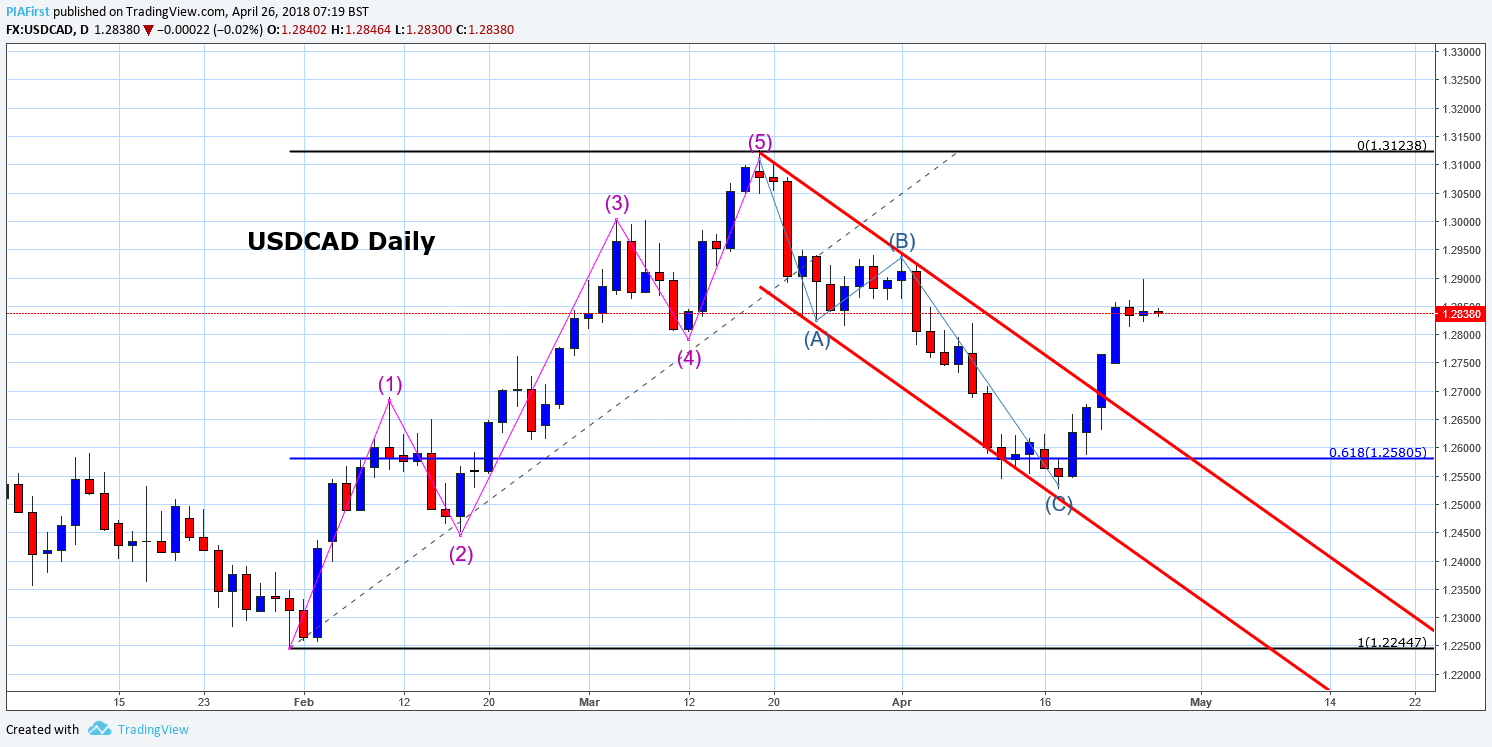
Daily: Daily chart highlights an Elliott Wave completion at 1.3123 (bullish 5-waves) followed but a 3-wave correction lower. Buyers re-emerged under the 61.8% pullback level of 1.2580 (from 1.2245-1.3123). We have broken the channel to the upside. Yesterdays price action formed a Doji style candle and highlights a possible temporary top is in place.
Intraday (four-hours) – Stalls at the intraday 261.8% extension of 1.2882 (from 1.2527 – 1.2657). Although we have seen a correction lower, we look for this move to be mild and temporary. Channel support is seen at 1.2781. With bespoke support at 1.2785, this is our prime zone to get long.
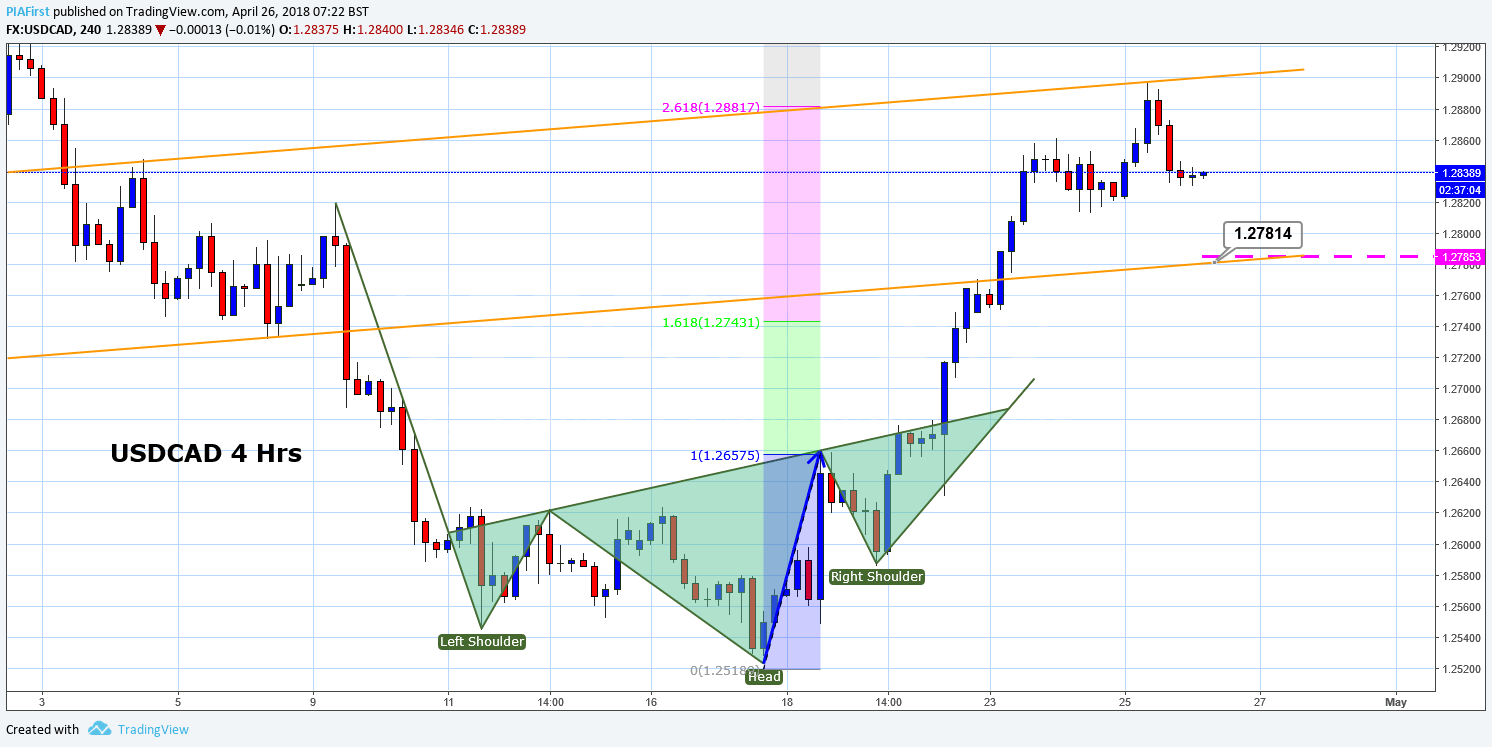
We look to Buy at 1.2785
Stop: 1.2685
Targets: 1.3140 and 1.3440
Article produced by Pia Firs for Orbex Limited
Visit PIA First for FX, Commodity & Stock Market trade ideas
Author

Ian Coleman
FXStreet
Ian started his financial career at the age of 18 working as a Junior Swiss Broker at Godsell Astley and Pearce (London). He quickly moved through the ranks and was Desk Manager at RP Martins at the age of 29.


