USD/CAD bounces off a key long-term resistance

We’ve spotted a great selling opportunity on the USDCAD and it’s a great occasion for both the mid and long-term. First, let me show you the big picture and the handsome price action that can be seen on a weekly chart.
So, the main thing on the weekly chart is that the price is in a long-term down-trend. Most recently, we were in the bullish correction but it doesn’t change the long-term mood. A correction managed to test a key resistance on a psychological barrier of 1.3 (yellow). It was a crucial level for the past four years and it is still crucial now.
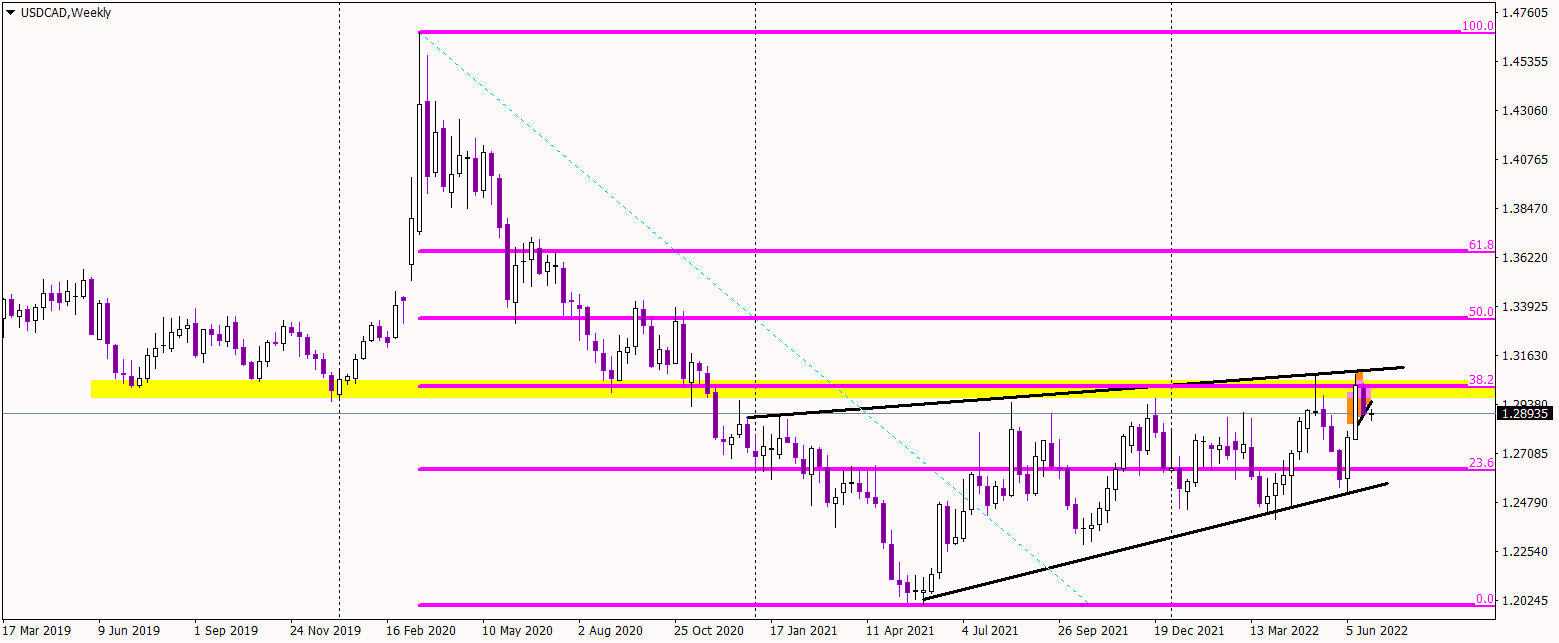
1.3 is additionally in the same place as the 38,2 % Fibonacci, which only strengthens this area. USDCAD tested that resistance twice and both of those times were unsuccessful. That creates a double top formation.
Interestingly, if we look closer, the second top is in the same time a smaller Head and Shoulders pattern! This pattern is already up and running as the USDCAD managed to break its neckline. With this, we have a sell signal on both time horizons: mid-term and the long-term. A potential target is on the 23,6% Fibo and the lower line of the wedge. With all that, chances that we will get there are quite high.
Author

Tomasz Wisniewski
Axiory Global Ltd.
Tomasz was born in Warsaw, Poland on 25th October, 1985.


