USD/CAD at 8-month high; looks bullish above trendlines [Video]
![USD/CAD at 8-month high; looks bullish above trendlines [Video]](https://editorial.fxstreet.com/images/Markets/Currencies/Majors/USDCAD/canadian-dollars-57161236_XtraLarge.jpg)
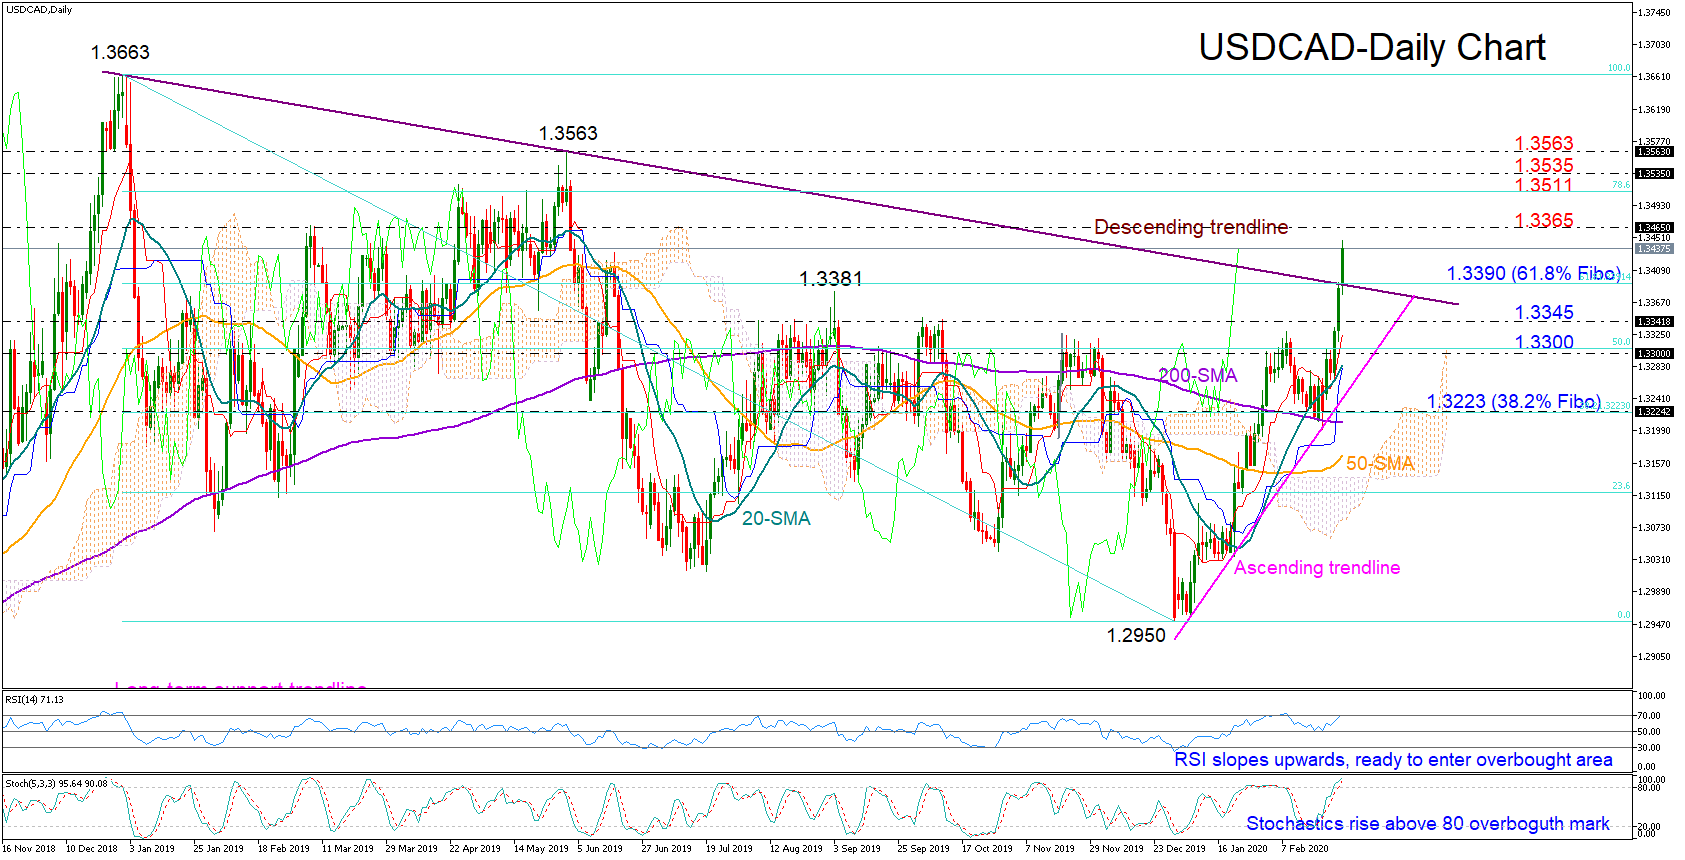
USDCAD refused to close below the 200-day simple moving average (SMA) and the supportive trendline last week, staging a remarkable rally instead that led the price above the long-term ascending trendline and to eight-month highs on Friday.
The price also pierced the 61.8% Fibonacci of the 1.3663-1.2950 downleg, increasing hopes that more gains could be achieved, with the rising RSI and Stochastics – which have yet to confirm overbought conditions – backing this view as well.
Slightly higher, the area around 1.3465 has been frequently tested in previous years and could attract attention in the short-term. Running above it, a more important resistance could appear around the 78.6% Fibonacci of 1.3511, a break of which would bring the 1.3535 barrier taken from the 2016-2017 highs under the spotlight ahead of the 1.3563 support-turned-resistance level.
In the negative scenario, a pullback below the descending trendline and the 61.8% Fibonacci of 1.3390 could last until the 1.3345-1.3300 restrictive area, which includes the 50% Fibonacci. Lower, the 20-day SMA and the ascending trendline could reject downside corrections once again. If not, the door would open for the 38.2% Fibonacci of 1.3223 and the 200-day SMA.
Looking at the medium-term picture, the outlook has switched from neutral to positive following the rally above the descending trendline and the 1.3381 peak. Yet, with the 50-day SMA holding below the 200-day SMA, the bullish outlook is still looking fragile.
Summarizing, USDCAD is currently viewed as bullish both in the short- and medium-term timeframe.
Author

Christina joined the XM investment research department in May 2017. She holds a master degree in Economics and Business from the Erasmus University Rotterdam with a specialization in International economics.


