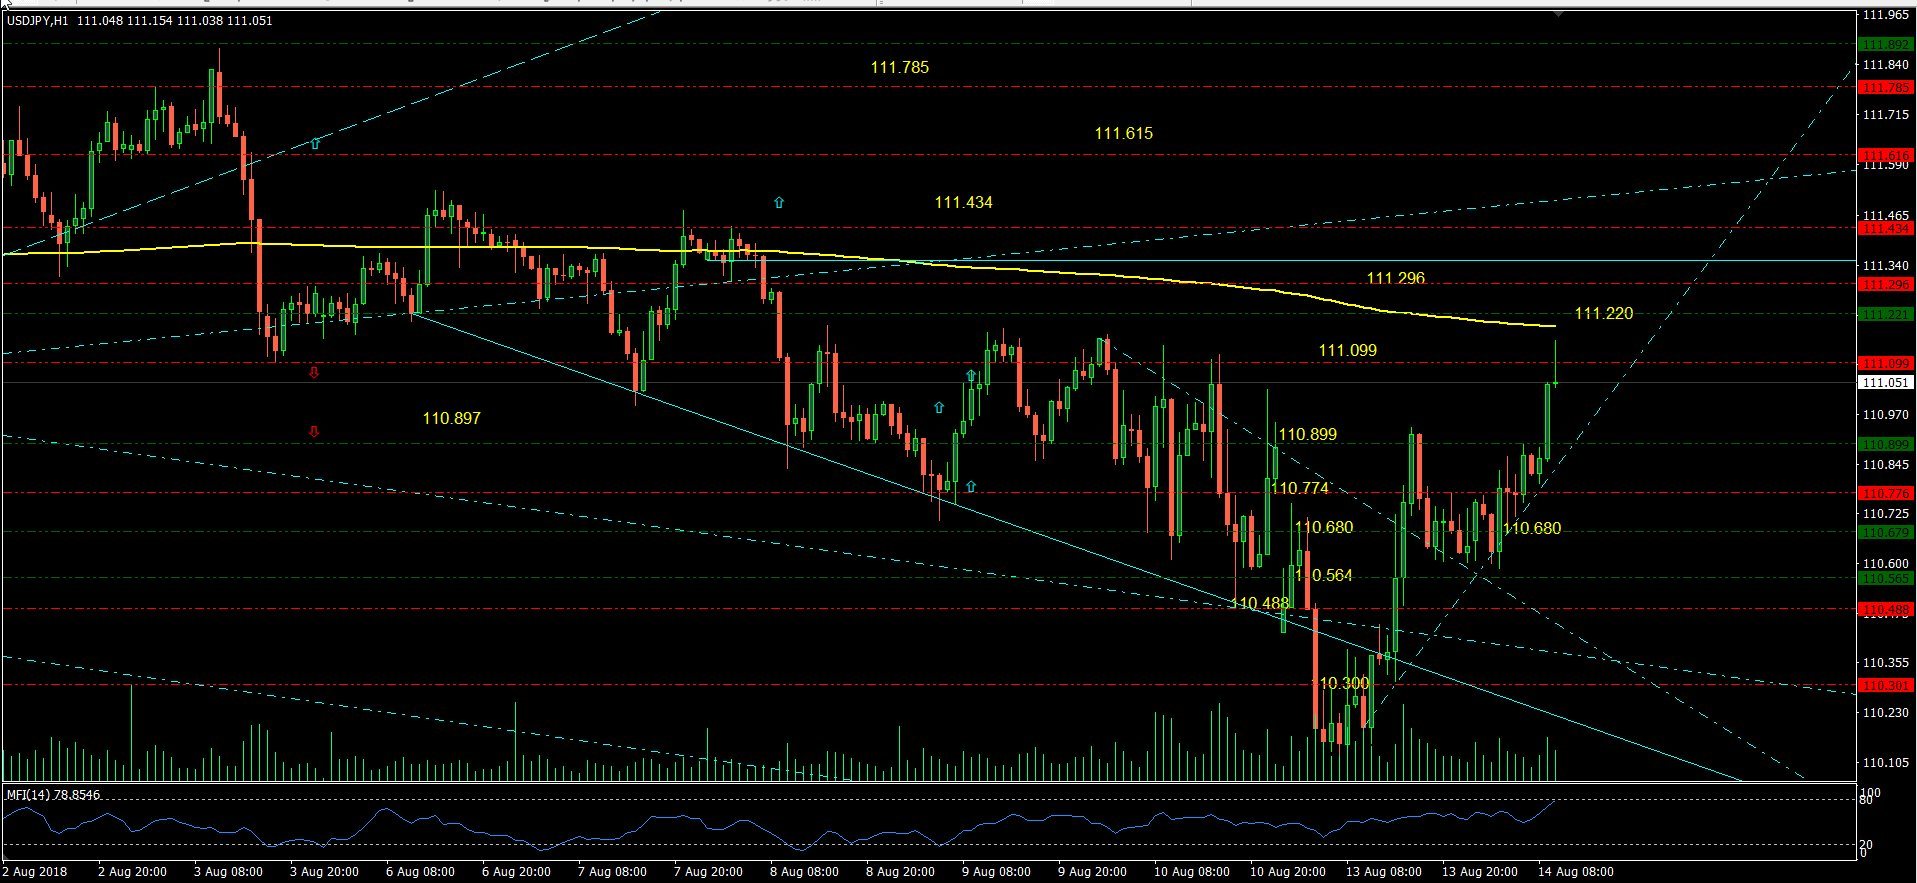
USD/JPY: US dollar faces a fresh challenge at 111.099

What happened in the last 24 hrs of the trading session?
USD/ JPY: The US dollar broke out of the falling wedge price pattern and shot up to 110.899. However, it failed and pulled back to 110.680. The second attempt was successful.
What is going on now?
USD/ JPY: The US dollar pulled through on its second attempt at 110.680 and reached 111.099 resistance. However, it is starting to show signs of weakness to the upside in the 60 minutes time frame. It is currently trading at 111.069 and is attempting to breakthrough 111.099 resistance.
My thoughts on what may happen
USD/ JPY: The pair needs to break and hold above 111.099 and also its 500 EMA line at around 111.220 to continue to the upside. If it fails to move on, then it could fall to 110.899. The current short to medium term trend points to the upside; however, the trend could change if it falls below 110.744.
The short-term view of the price action in the 60 minutes price chart highlights the direction of the trend and the support and resistance price points
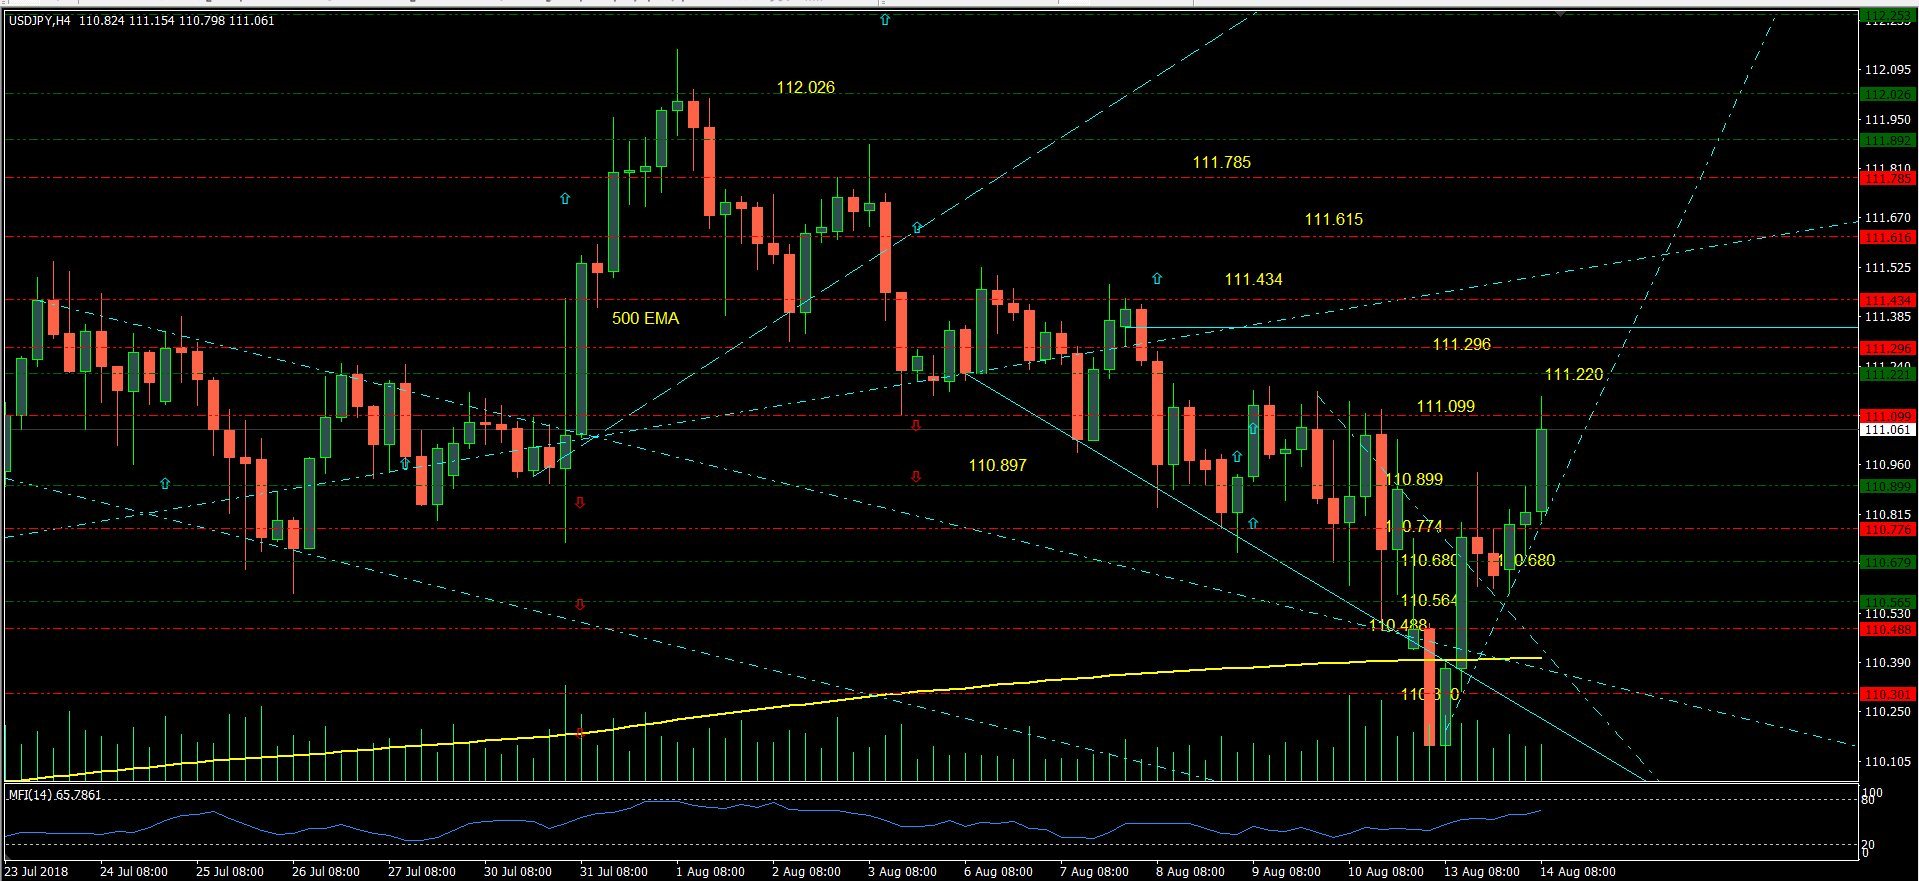
The short-term view of the price action in the four-hour price chart highlights the direction of the trend and the support and resistance price points
Author

Denis Joeli Fatiaki
Independent Analyst
Denis Joeli Fatiaki possesses over a decade of extensive experience as a multi-asset trader and Market Strategist.


