|

USD/JPY Uptrend Remains Valid with Price Above 107.50 Support

The USD/JPY made a bullish breakout during yesterday’s FOMC and interest rate cut in the US to 2% but ultimately was unable to break above the resistance trend line (red). Price is now testing the support Fibonacci levels of wave 4 (blue).
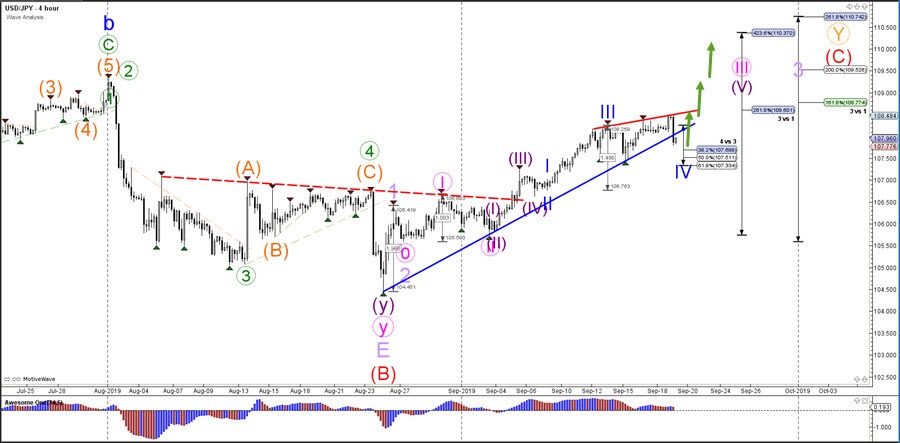
USDJPY

USD/JPY

4 hour

The USD/JPY could bounce at the Fibonacci levels of wave 4 vs 3 if the wave pattern is correct. A break below the 61.% Fibonacci level of wave 4 vs 3 invalidates the wave 4 (blue) pattern and indicates a larger bearish retracement. A bullish break above the 108.50 target means that an uptrend continuation towards the Fibonacci targets is likely.
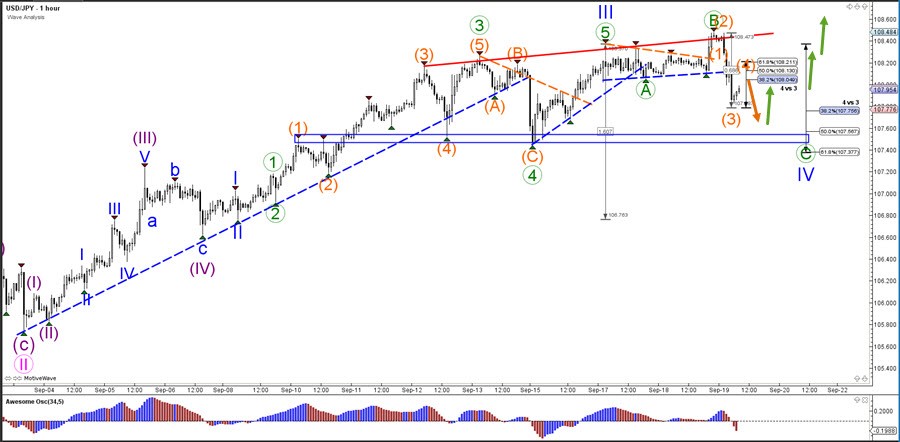
USDJPY

1 hour

The USD/JPY seems to be building a bearish ABC (green) pattern within the wave 4 (blue). The price action remains bullish as long as price stays above the key support zone (blue box). One more lower low is possible if the price respects the Fibonacci retracement levels of wave 4 vs 3.

USDJPY

The analysis has been done with the CAMMACD.MTF template.

For more daily technical and wave analysis and updates, sign-up up to our ecs.LIVE channel.

Author

Chris Svorcik

Chris Svorcik

Elite CurrenSea

Experience Chris Svorcik has co-founded Elite CurrenSea in 2014 together with Nenad Kerkez, aka Tarantula FX. Chris is a technical analyst, wave analyst, trader, writer, educator, webinar speaker, and seminar speaker of the financial markets.

More from Chris Svorcik
Share:

Editor's Picks

EUR/USD trims gains, hovers around 1.1900 post-US data

EUR/USD trades slightly on the back foot around the 1.1900 region in a context dominated by the resurgence of some buying interest around the US Dollar on turnaround Tuesday. Looking at the US docket, Retail Sales disappointed expectations in December, while the ADP 4-Week Average came in at 6.5K.

GBP/USD comes under pressure near 1.3680

The better tone in the Greenback hurts the risk-linked complex on Tuesday, prompting GBP/USD to set aside two consecutive days of gains and trade slightly on the defensive below the 1.3700 mark. Investors, in the meantime, keep their attention on key UK data due later in the week.

Gold loses some traction, still above $5,000

Gold faces some selling pressure on Tuesday, surrendering part of its recent two-day advance although managing to keep the trade above the $5,000 mark per troy ounce. The daily pullback in the precious metal comes in response to the modest rebound in the US Dollar, while declining US Treasury yields across the curve seem to limit the downside.

XRP holds $1.40 amid ETF inflows and stable derivatives market

Ripple trades under pressure, with immediate support at $1.40 holding at the time of writing on Tuesday. A recovery attempt from last week’s sell-off to $1.12 stalled at $1.54 on Friday, leading to limited price action between the current support and the resistance.

Dollar drops and stocks rally: The week of reckoning for US economic data

Following a sizeable move lower in US technology Stocks last week, we have witnessed a meaningful recovery unfold. The USD Index is in a concerning position; the monthly price continues to hold the south channel support.

XRP holds $1.40 amid ETF inflows and stable derivatives market

Ripple trades under pressure, with immediate support at $1.40 holding at the time of writing on Tuesday. A recovery attempt from last week’s sell-off to $1.12 stalled at $1.54 on Friday, leading to limited price action between the current support and the resistance.