USD/JPY: Strong US wage inflation would add credence to the rally
North Korea almost played a spoil sport earlier this week... In a sense that it poured cold water over the optimism generated by the repeated rebound in the USD/JPY pair from the 108.70 region.
The missile fired by North Korea over Japan torpedoed the US dollar and pushed the USD/JPY pair down to 108.274; the lowest level since April.
The previous dips in the USD/JPY pair and risk assets in general due to tensions in the Korean Peninsula were short lived. It was no different this time as both the SP500 and the USD/JPY pair regained the bid tone.
The Dollar-Yen pair, which had dropped to 108.27 on Tuesday, now trades at 110.30 levels. The daily high stands at 110.67 levels.
Rally isn’t backed by the yield curve
It is well known by now that the USD responds positively to a steeper yield curve and vice versa. By yield curve, we mean the spread between the 10-year Treasury yield curve and the 2-year Treasury yield curve. The wider [Steeper] the spread, the stronger is the USD and vice versa.
The three-day rally in the USD/JPY pair from 108.27 to 110.67 isn’t accompanied by the sharp steepening of the yield curve. The spread currently stands at 80 basis points… Only 2 basis points higher than the reading of 78 basis points seen on Tuesday.
Clearly, the rally in the USD/JPY lacks the support of the bond markets. This makes the pair extremely vulnerable to a weak US wage growth data due for release tomorrow at 12:30 GMT.
Focus on wage growth numbers
As said earlier, the USD responds positively to a steeper yield curve, which in turn closely follows the inflation expectations. Higher wage price inflation would yield a steeper yield curve and add credence to the USD/JPY rally.
The story was quite different till end 2016. The USD used to cheer the flattening of the yield curve, i.e. resilience/relatively sharp rise in the 2-year yield. However, the greenback has been following the long duration yields more closely this year.
The dollar may also take heart from the strong non-farm payrolls figure, although job gains could be interpreted the other way round as well. A strong NFP along with an improvement in the labor force participation rate would mean people are feeling increasingly confident about the US growth story. In such a case, the Fed would want to avoid raising rates at a faster rate since strong jobs gains highlights the slack in the labor market.
Strong wage price inflation numbers would not only boost rate hike bets, but also improve the odds of the Fed beginning the balance sheet runoff program in September.
USD/JPY - Potential double bottom
Daily chart
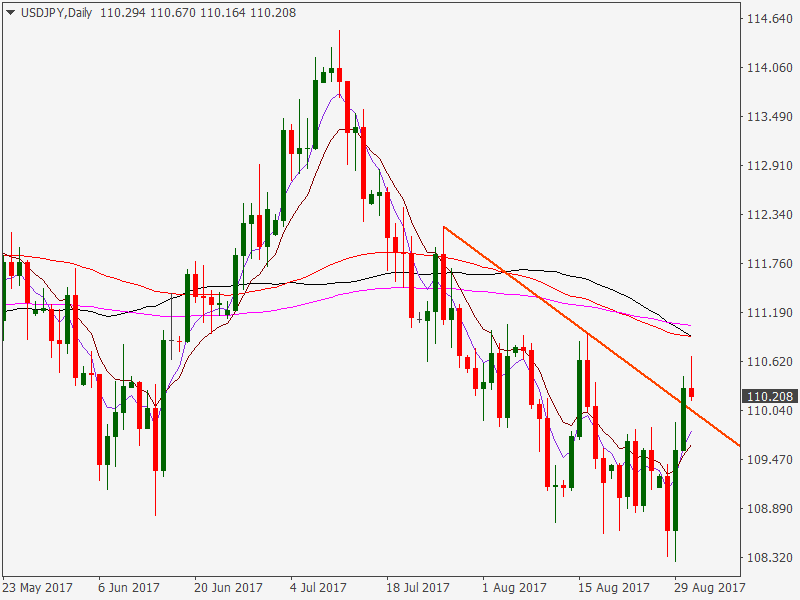
- The chart above shows a double bottom formation with the neckline support at 110.95.
- An end of the day close above the same would signal the sell-off from the recent high of 114.49 has ended and could yield 112.12 [61.8% Fib R of 114.49-108.27].
- On the downside, only an end of the day close below 109.54 [previous day’s low] would signal bullish invalidation, although on a larger scheme of things, the sell-off from 114.49 would resume following a break below the psychological level of 108.00.
Scenarios:
Strong wage growth data could yield double bottom breakout. However, don’t go just by the chart. Keep an eye on the yield curve. A double bottom breakout, coupled with a steeper yield curve would signal sustainable gains.
Weak wage growth numbers would remind traders that the three-day rally isn’t backed by the steeper yield curve, thus leading to a fresh sell-off towards key support levels of 108.71-108.13-108.00.
Author

Omkar Godbole
FXStreet Contributor
Omkar Godbole, editor and analyst, joined FXStreet after four years as a research analyst at several Indian brokerage companies.


