USD/JPY near 40-year highs: Bullish structure meets intervention and positioning risk

USD/JPY remains supported by a wide US–Japan interest-rate differential, positive carry and a firmly bullish technical structure. Yet with the pair trading above 163, speculative yen shorts already substantial and Japanese intervention risk rising, the immediate entry is less convincing than the underlying bullish thesis.
USD/JPY has moved into territory not seen for roughly four decades, trading above 163 and leaving the Japanese Yen near its weakest level against the US Dollar since 1986.
The reasons behind the move are relatively clear. US interest rates remain considerably higher than Japanese rates, the Dollar continues to offer attractive carry, and the Bank of Japan is normalising monetary policy at a measured pace.
The trading decision is less straightforward.
At current levels, USD/JPY no longer offers the same risk profile that existed earlier in the trend. The pair is testing major long-term resistance, speculative investors already hold substantial short-yen exposure, and Japanese authorities have shown that intervention is more than a verbal threat.
The result is a market where the underlying direction remains bullish, but the case for chasing the move has weakened.
US–Japan policy divergence continues to favour USD/JPY
The Federal Reserve maintained its target range at 3.50%–3.75% at its June meeting. Policymakers described US economic activity as expanding at a solid pace and acknowledged that inflation remained elevated relative to the 2% objective.
That does not provide an obvious foundation for rapid monetary easing.
For USD/JPY, the key question is not simply whether the Fed will eventually reduce rates. It is whether US rates will fall sooner or more quickly than financial markets currently expect.
A weak economic release can cause a temporary decline in the Dollar. A sustained USD/JPY reversal would probably require a broader deterioration in US employment, consumption or growth, accompanied by a meaningful fall in short-term Treasury yields.
The Bank of Japan, meanwhile, has continued to move away from the ultra-loose policy regime that defined the Japanese economy for many years. Its policy rate has risen to around 1%, and officials have indicated that further adjustments remain possible if wages, inflation and economic activity develop in line with expectations.
This is supportive of the Yen at the margin, but the relative policy gap remains wide. A 1% Japanese rate is still substantially below the Federal Reserve’s 3.50%–3.75% range.
The Yen would receive stronger support if markets began pricing a faster BoJ tightening cycle, a materially lower Fed path, or both. Until that happens, the rate differential remains an important fundamental anchor for USD/JPY.
Positive carry supports the trend but creates asymmetric risk
The interest-rate gap also keeps USD/JPY relevant as a carry trade.
Investors can fund positions in a lower-yielding currency such as the Yen and allocate capital to higher-yielding Dollar assets. Provided that the exchange rate remains stable or moves in the investor’s favour, the strategy earns the interest-rate differential.
Carry trades tend to perform best when volatility is low and global risk appetite is stable. Those conditions encourage traders to maintain leverage and stay invested.
The weakness is that carry returns accumulate gradually, while reversals can happen quickly.
If volatility rises or the policy outlook changes, investors may rush to reduce similar positions at the same time. Closing a yen-funded carry trade requires buying Yen, which can accelerate a decline in USD/JPY.
This helps explain why the pair can rise steadily over several months and then fall several hundred pips in a much shorter period.
Positive carry supports the current trend. It also creates the conditions for a more violent correction if the market turns.
Japanese capital flows add a structural layer
Japan’s international investment position is another important part of the picture.
Japanese residents hold a very large stock of overseas bonds, equities and other assets. Pension funds, life insurers, banks and asset managers regularly decide whether to allocate capital domestically or abroad.
When overseas yields are more attractive and foreign investments are left unhedged, those decisions can involve selling Yen and purchasing Dollars or other currencies.
The flow can slow or reverse if Japanese yields become more competitive, foreign yields decline, hedging costs change or institutions decide to repatriate capital.
These structural flows tend to develop more slowly than speculative positions. Even so, they help explain why the Yen can remain weak despite gradual BoJ tightening.
Professional FX analysis therefore cannot stop at central-bank announcements. Longer-term investment behaviour can continue to influence the currency long after the immediate policy reaction has faded.
Intervention risk is no longer theoretical
Japan has already demonstrated its willingness to intervene directly in the foreign-exchange market.
The Ministry of Finance reported intervention totalling more than ¥11 trillion between late April and late May 2026. As USD/JPY moved through 163, Japanese officials again warned that they were prepared to take decisive action against excessive currency movements.
The authorities are unlikely to focus on one exchange-rate level in isolation. The speed and character of the move also matter.
A slow and orderly rise may be treated differently from a rapid, one-sided advance driven by speculative positioning. Officials also need to consider the impact of Yen weakness on imported energy, food and other consumer costs.
Intervention can trigger a powerful short-term fall in USD/JPY, particularly when leveraged positioning is concentrated. Its lasting effect is less certain.
If US yields remain high and the US–Japan policy gap stays wide, official Yen buying may interrupt the trend without changing its fundamental direction. Intervention is more likely to produce a durable reversal when it is reinforced by falling US yields, faster BoJ tightening or a broader unwind in global risk positions.
Positioning confirms the trend and increases squeeze risk
The latest available CFTC data showed non-commercial traders holding 115,965 long Japanese Yen futures contracts and 238,628 short contracts. That produced a net-short Yen position of 122,663 contracts.
The direction needs to be interpreted carefully. These are Japanese Yen futures positions rather than direct USD/JPY trades.
A short-Yen futures position generally reflects an expectation of Yen weakness and is therefore broadly consistent with a bullish USD/JPY view.
The positioning confirms that speculative investors agree with the prevailing trend. That can remain supportive while the interest-rate and carry arguments remain intact.
However, it also increases squeeze risk.
If a catalyst causes USD/JPY to fall, traders closing Yen shorts must buy the currency back. A sufficiently large wave of short covering can turn an orderly correction into a much faster move.
Crowded positioning is not an automatic reversal signal. A popular trade can remain profitable for a long time. What crowding changes is the potential speed of the adjustment once the consensus begins to unwind.
Monthly trend remains firmly bullish
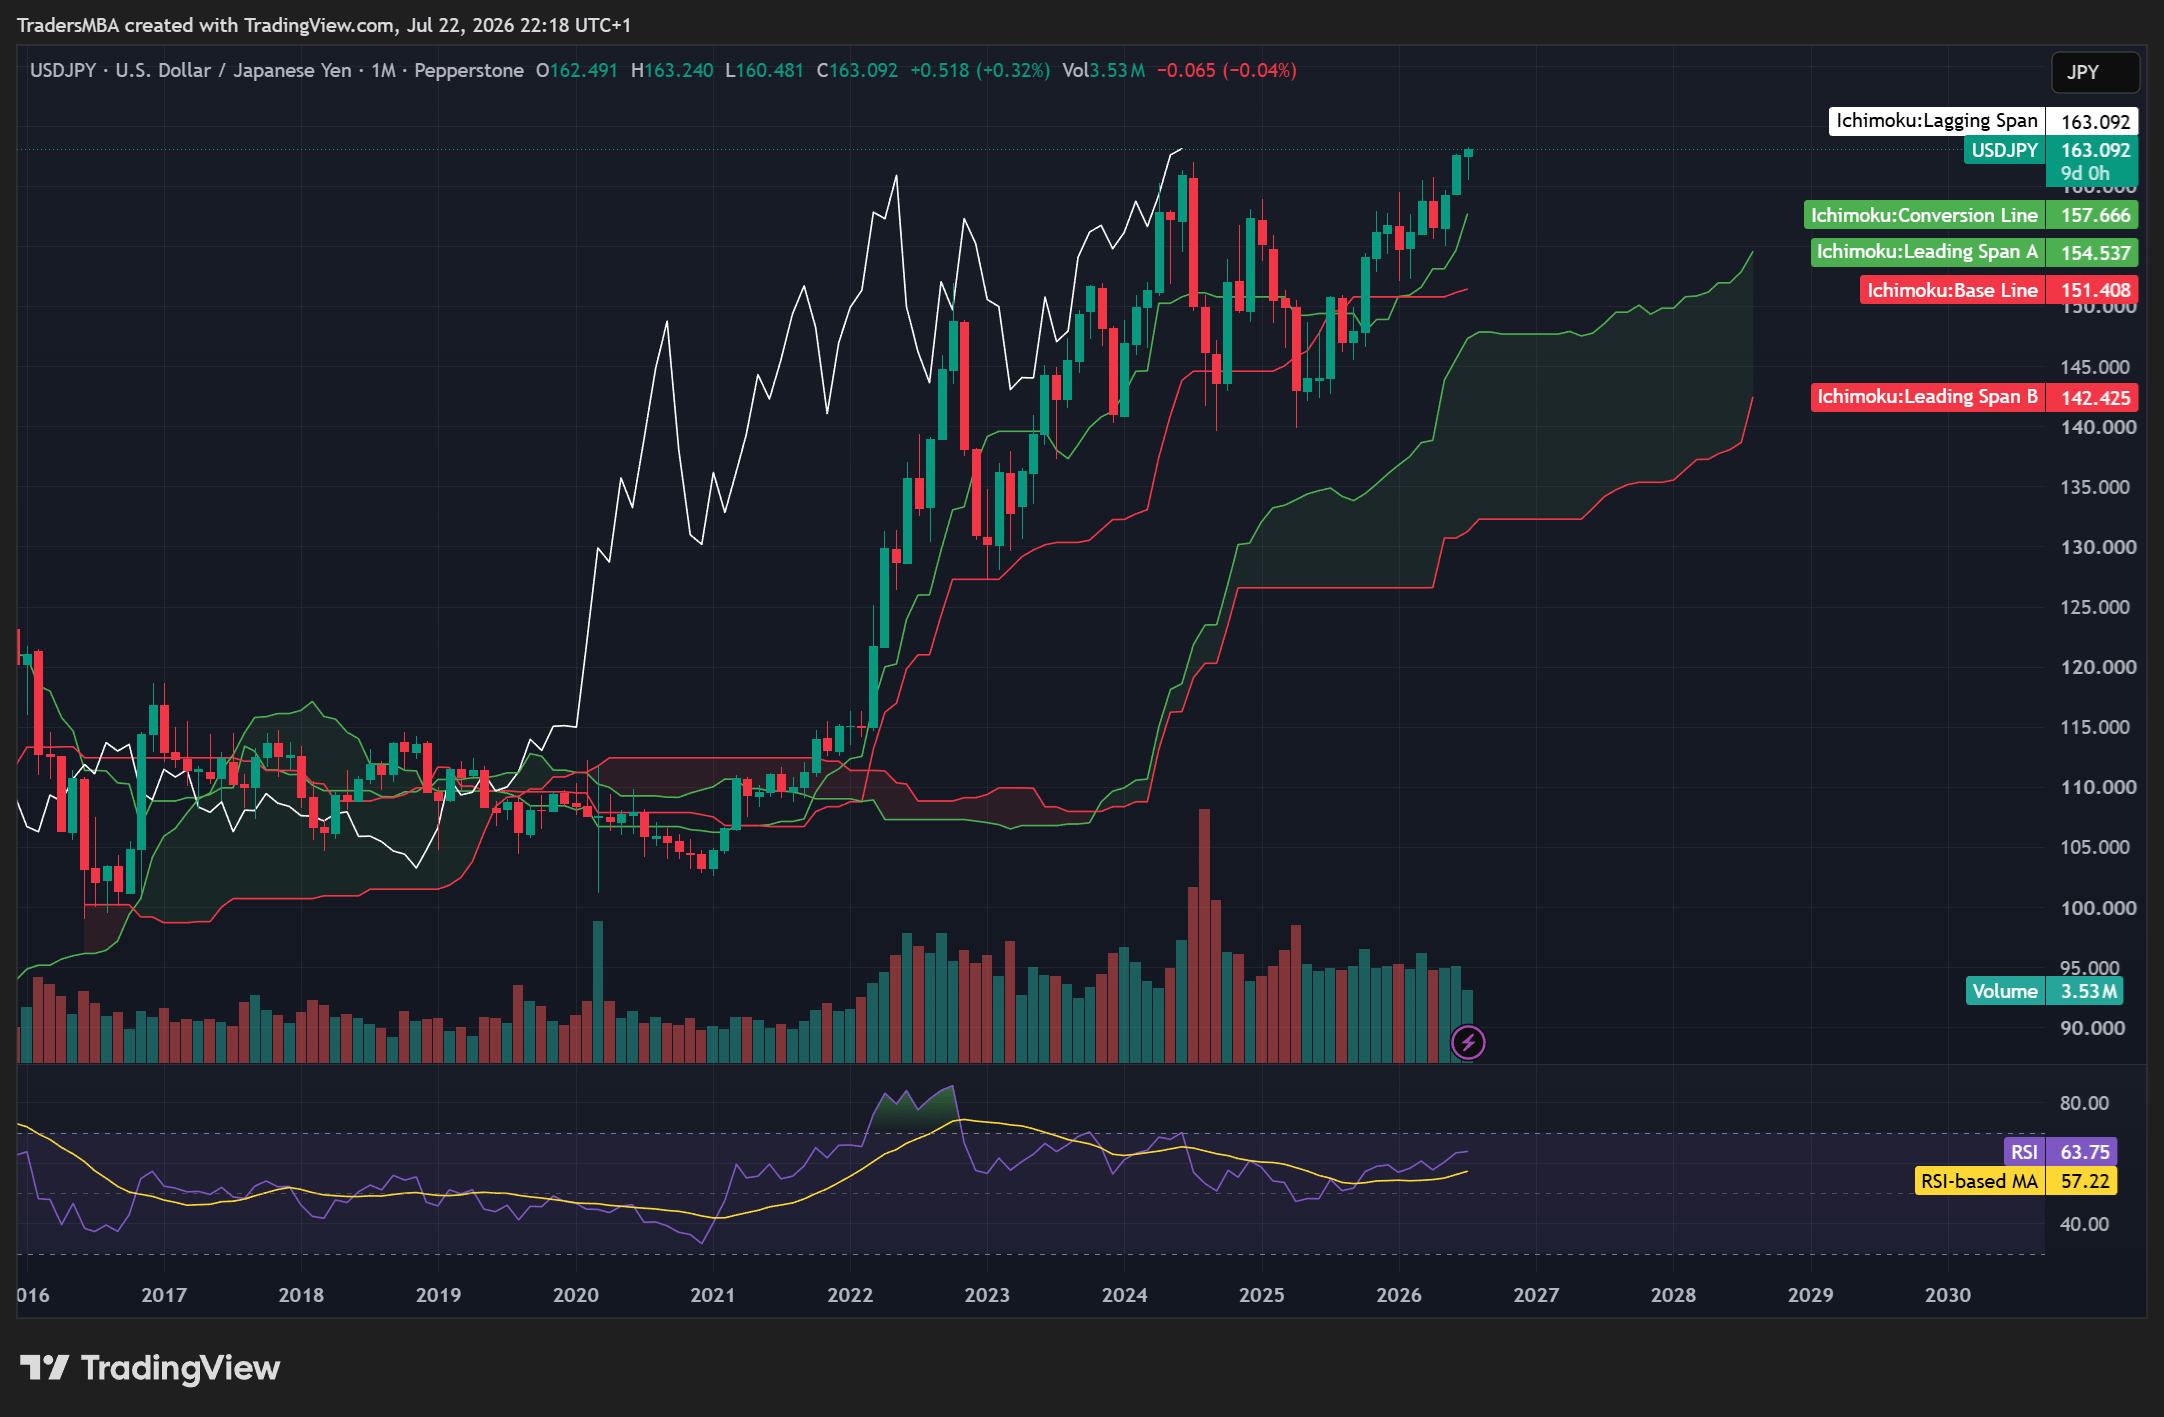
The monthly chart retains a strong upward structure.
USD/JPY is trading above its previous major long-term highs and remains well above the monthly Ichimoku Cloud. At the time of the chart analysis, the monthly Tenkan-sen was near 157.67 and the Kijun-sen was around 151.41.
Price was therefore more than 11 Yen above the monthly Kijun, showing a significant departure from medium-term equilibrium.
The Ichimoku configuration remains constructive. Price is above the cloud, the Tenkan-sen is above the Kijun-sen, the projected cloud remains positive and the Chikou Span is positioned above previous price action.
Monthly RSI was around 63.7. Momentum was strong, but it had not moved above the conventional overbought threshold of 70.
The distance from the monthly Kijun increases the risk of mean reversion. It does not show that a reversal has started.
An extended trend can remain extended, particularly when monetary policy, carry and momentum continue to point in the same direction.
Weekly chart tests a major breakout area
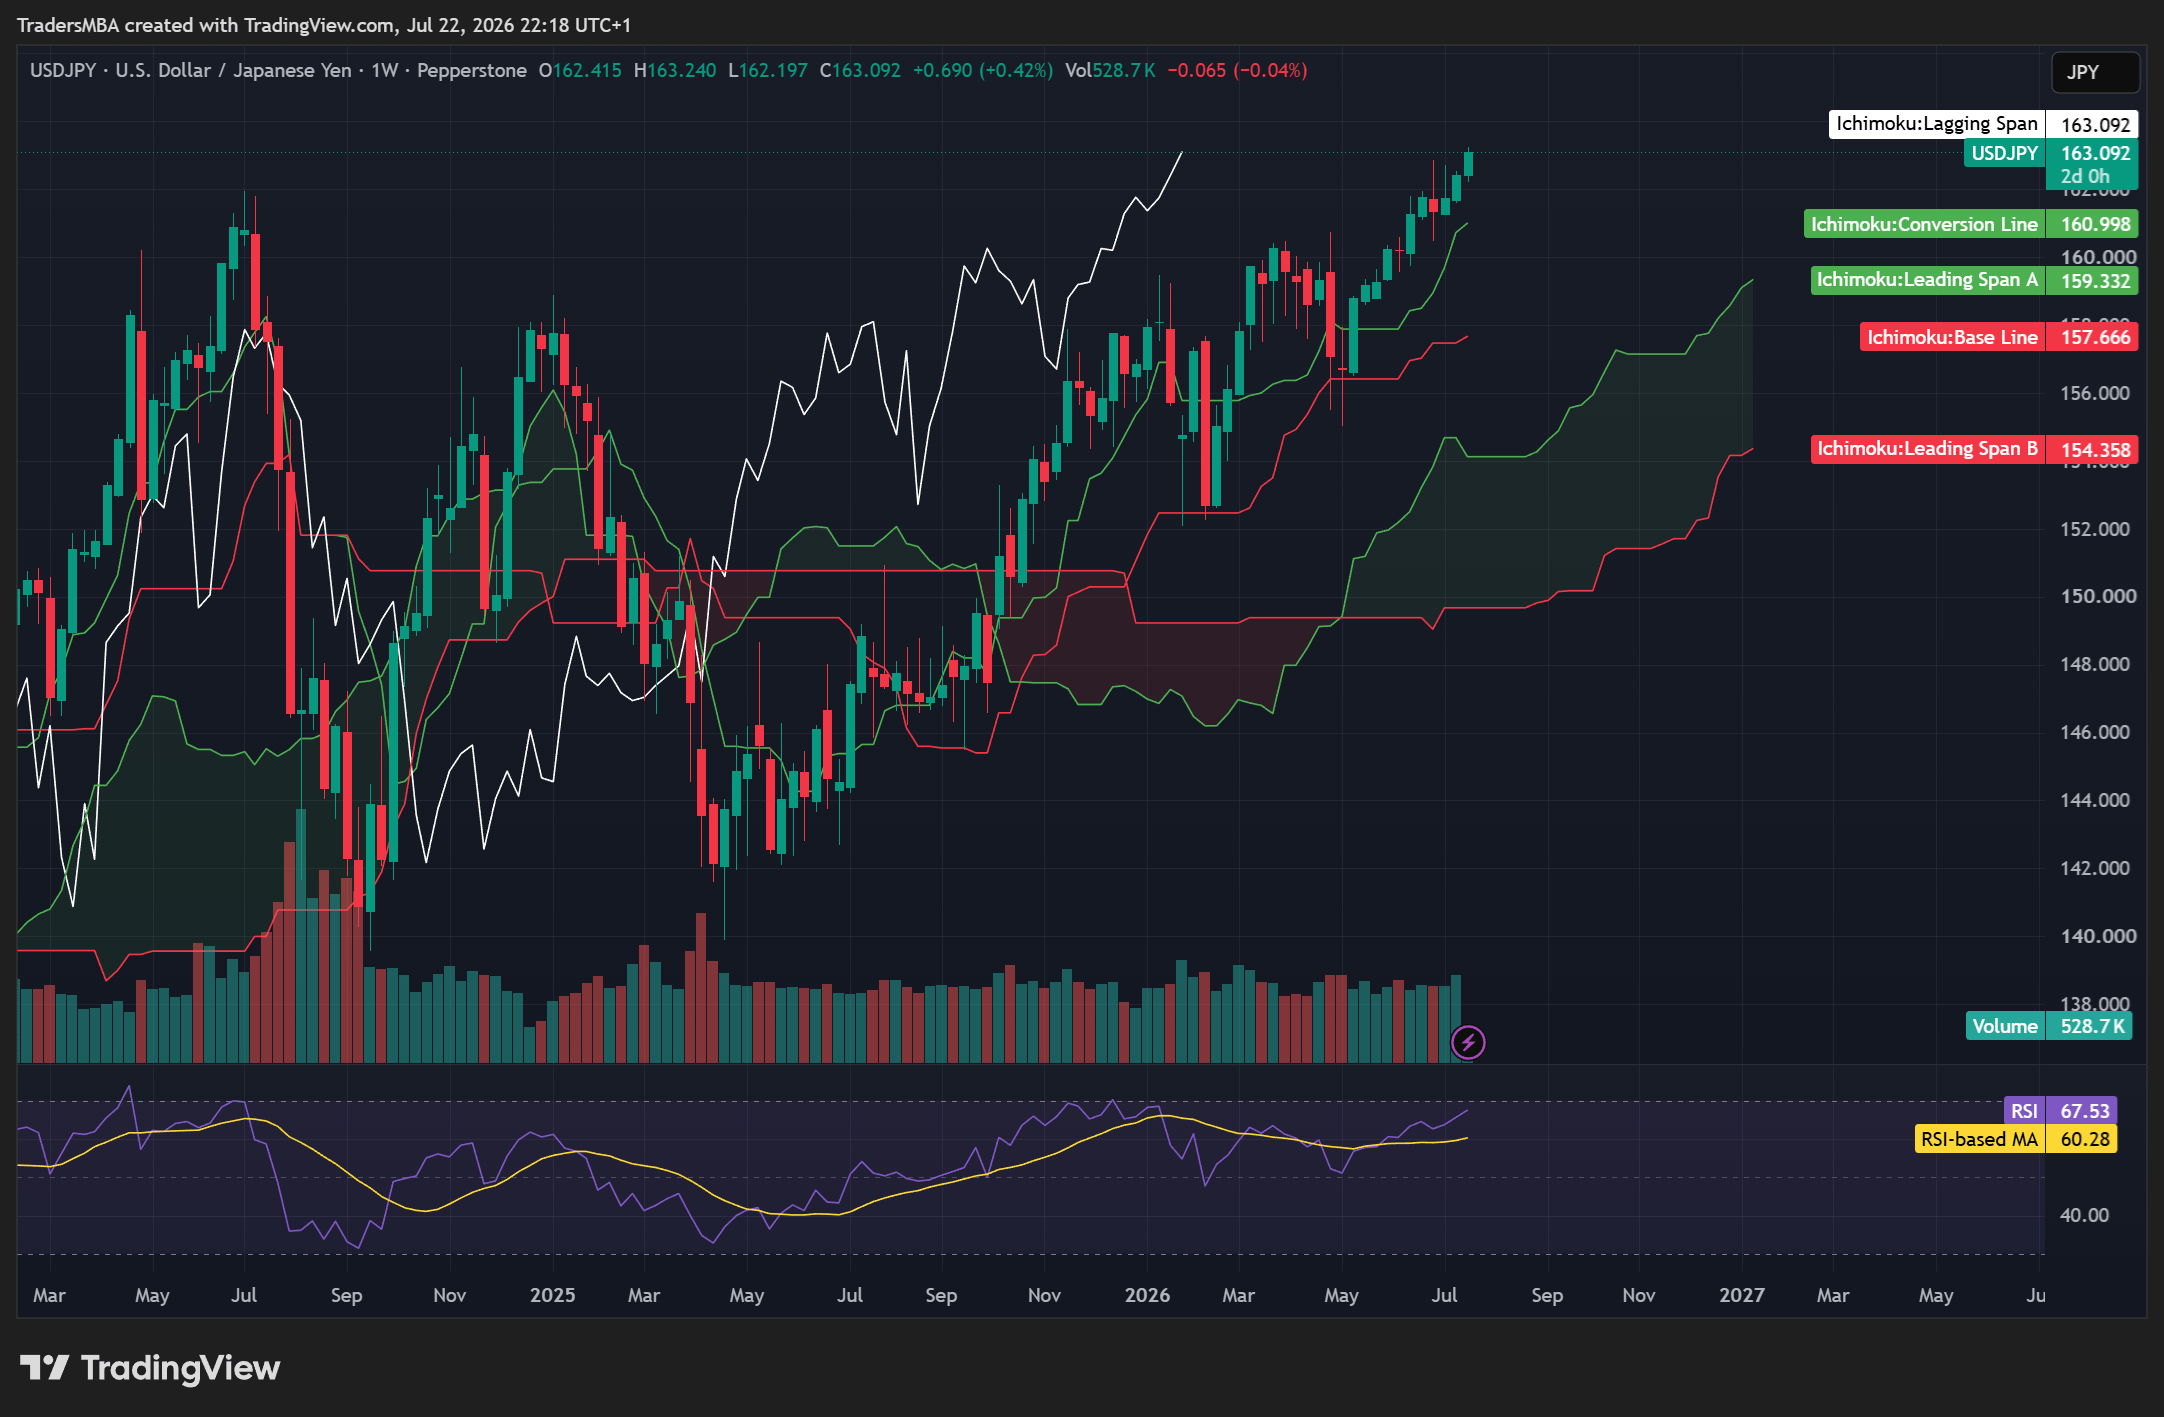
The weekly picture is similarly bullish.
USD/JPY recovered strongly from its 2025 correction and continued to form higher highs and higher lows. Price remained above the weekly Ichimoku Cloud, with the weekly Tenkan-sen close to 161 and the Kijun-sen around 157.67.
Weekly RSI stood near 67.5 at the time of the chart capture. That is elevated, but it does not constitute a reversal signal on its own.
The central technical question is whether USD/JPY can establish acceptance above the 163.20–163.30 area.
A weekly close above that zone, followed by continued trading above it, would support a continuation into price discovery.
A move above 163.30 that quickly reverses and closes below the breakout area would instead raise the risk of a false break.
The weekly chart had not yet produced a confirmed lower high, a break of an important higher low or a bearish Ichimoku crossover. Selling the pair at current levels would therefore mean anticipating a top rather than responding to an established reversal.
Daily chart defines the immediate decision
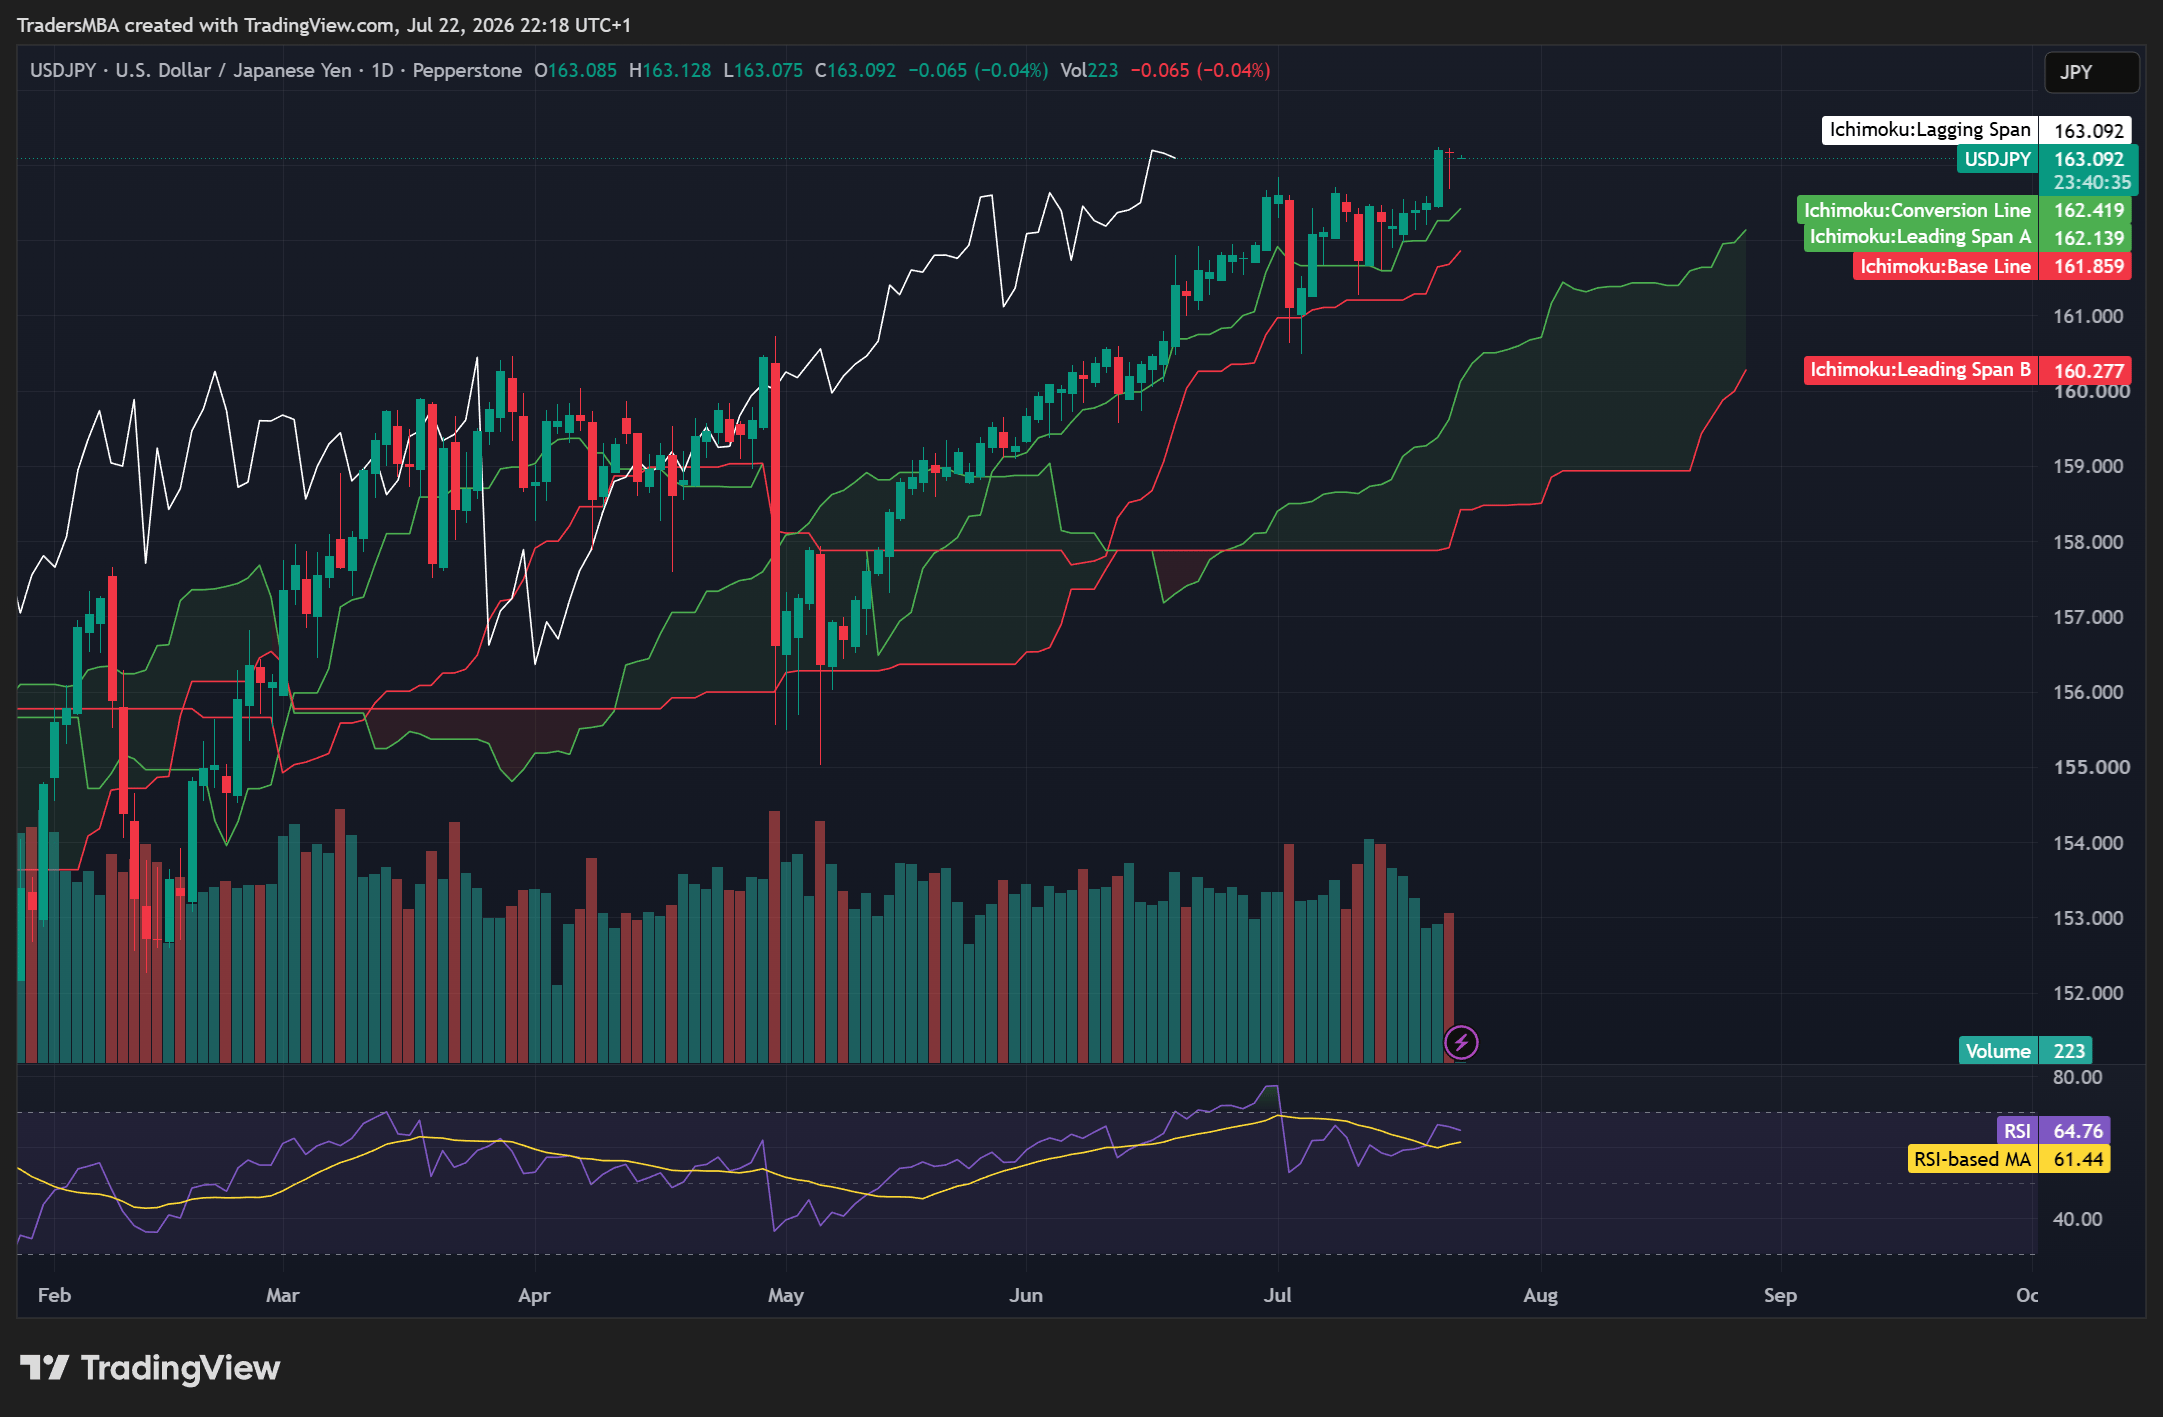
The daily chart provides the clearest map for execution.
Immediate resistance sits around 163.20–163.30. The first meaningful support is near the daily Tenkan-sen around 162.20–162.30.
A stronger support cluster lies around 161.65–162.00, where the daily Kijun-sen and projected cloud top converge. Beneath that, the weekly Tenkan-sen is positioned close to 161.
The lower boundary of the daily cloud sits around 160, while the weekly Kijun-sen near 157.67 represents a more important swing support level.
Price remains above all of the main Ichimoku components.
A pullback towards 162.20 or the stronger 161.65–162.00 support area would remain consistent with an intact uptrend. Such a move would bring price closer to short-term equilibrium without causing significant structural damage.
A daily close below approximately 161.7 would provide the first meaningful warning. The bearish case would become more credible if the pair then formed a lower high and broke below 160.9–161.0.
A sustained move below 160 would represent a more serious deterioration because USD/JPY would be trading beneath the lower boundary of the daily cloud.
Daily RSI shows a possible bearish divergence, with price testing a marginal new high while momentum remains below its earlier peak.
That is a reason to avoid chasing the market without confirmation. It is not sufficient evidence to establish a short position while price remains above support and the broader structure remains bullish.
The thesis is stronger than the immediate setup
Fundamental, technical and sentiment analysis currently produce a broadly consistent directional message.
The US rate advantage remains supportive. The multi-timeframe trend is bullish. Speculative positioning confirms that investors remain bearish on the Yen.
The quality of the immediate entry is less compelling.
The pair is testing major resistance, the market is already crowded in the prevailing direction and intervention risk is elevated.
This creates an important distinction between thesis quality and setup quality.
A trader may hold a well-supported bullish view while deciding that current prices do not offer enough reward relative to the risks. Equally, the possibility of intervention and crowded positioning may support a bearish scenario without yet providing technical confirmation of a reversal.
Bullish continuation
A convincing daily and weekly close above 163.30 would strengthen the breakout case.
Follow-through above the high, followed by a successful retest of the 163 area, could open the way towards 164 and 165. The principal risks would remain intervention and a sudden decline in US yields.
High-level consolidation
USD/JPY could remain between roughly 160 and 164 while the market waits for clearer guidance from the Fed, the BoJ and Japanese authorities.
This outcome would allow momentum and speculative positioning to reset without requiring a major change in the longer-term trend.
Corrective decline
A break below the 161.65–162.00 support cluster would create the first sign of deterioration.
A subsequent move below 160.9 and a failed attempt to recover the level would strengthen the case for a correction towards 159.30 and 157.70.
The decline would become more structurally significant if USD/JPY established sustained acceptance below 157.7.
Conclusion
USD/JPY remains supported by the relative monetary-policy backdrop, positive carry and a bullish technical structure across the monthly, weekly and daily timeframes.
However, the pair is testing a major long-term high at a time when speculative Yen shorts are substantial and Japanese authorities have already demonstrated a willingness to intervene.
The evidence does not yet confirm a bearish reversal. It also does not provide an especially attractive case for chasing the pair at current levels.
Acceptance above 163.20–163.30 would reinforce the bullish continuation scenario. A pullback that holds around 161.7–162.3 could offer a cleaner test of the trend. A break below 160.9, followed by a failed recovery, would mark a more meaningful change in the daily structure.
For now, USD/JPY presents a strong underlying thesis at a difficult entry point.
Author

Sachin Kotecha
International Trading Institute (ITI)
Sachin Kotecha is a multi-asset trader, Professor at the International Trading Institute, and creator of institutional trading frameworks, macroeconomic intelligence platforms, and professional trading education programmes.