USD/JPY holds ground amid Fed dovishness and BoJ uncertainty
-
USDJPY in a tight range, pressured by dovish Fed.
-
Technical outlook remains neutral.
-
Q4 bias leans bearish, with downside risks toward 139.80.

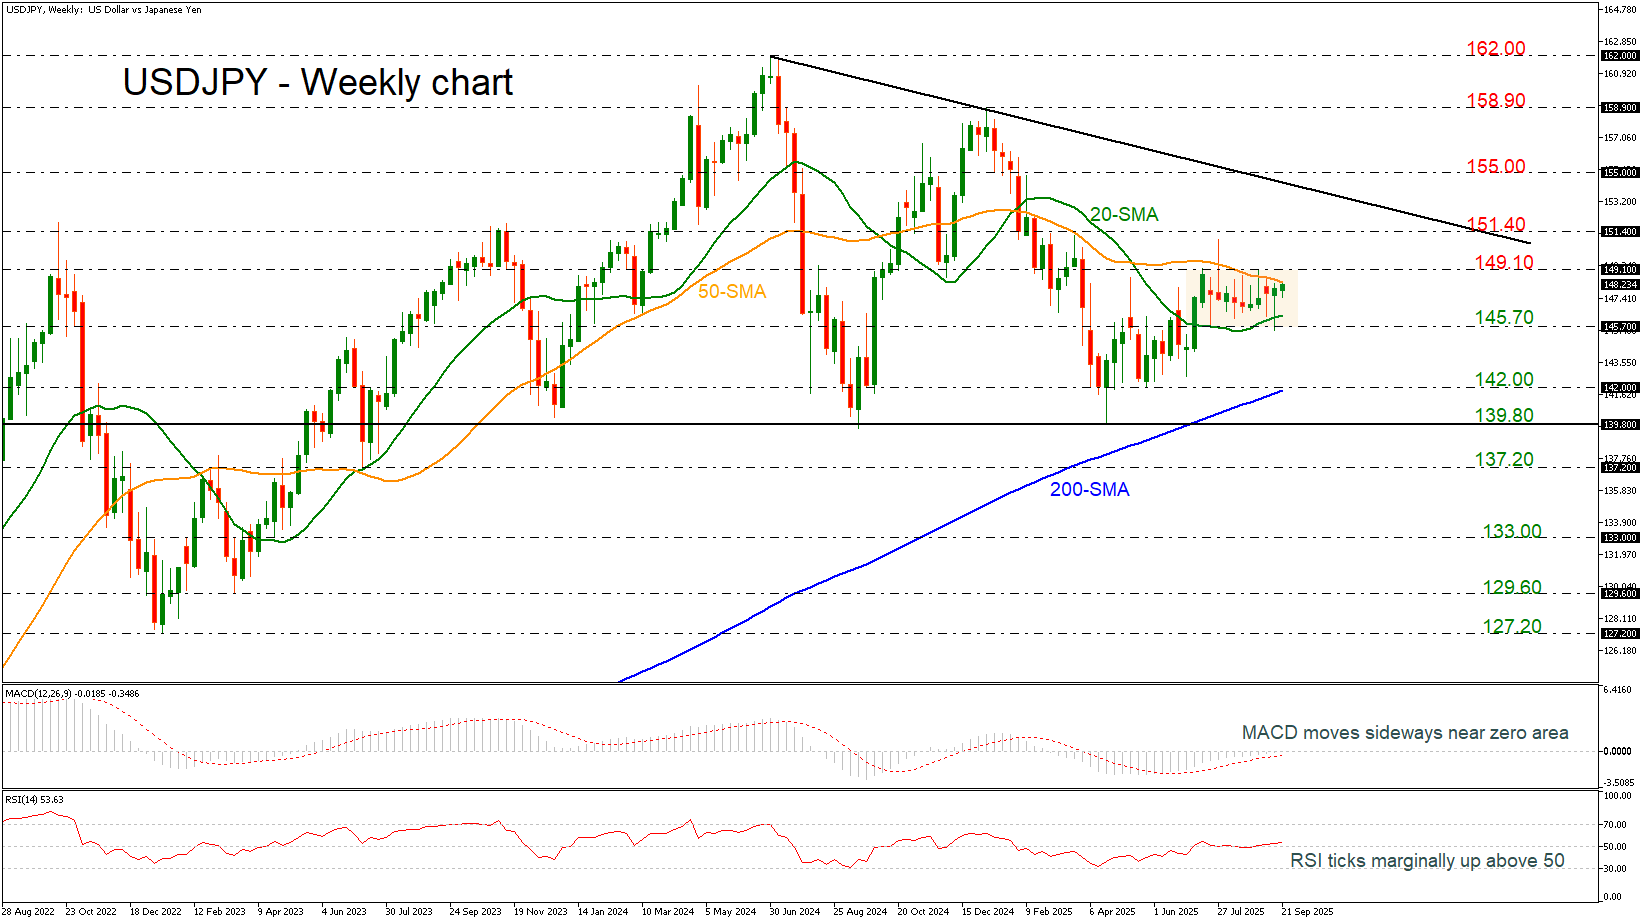
In the last two months, USDJPY has been developing within a tight range of 145.70-149.10, reflecting investor caution especially after key central bank decisions. The US dollar softened slightly to around 145.70 following Fed Chair Powell’s dovish remarks, which emphasized labor market weakness over inflation concerns. The Federal Reserve implemented a 25-basis-point rate cut, bringing the funds rate to 4.00–4.25%, and markets are pricing in up to four cuts by mid-2026. Meanwhile, the Bank of Japan maintained a cautious stance, with only a 20% chance of a rate hike priced in, amid political uncertainty following Prime Minister Ishiba’s resignation.
Technically, USDJPY remains trapped in a long-term descending triangle, with strong support at 139.80. Indicators such as MACD and RSI suggest neutral momentum, with the MACD hovering near the zero line and the RSI near 50. A break above the 50-week simple moving average (SMA) at 148.40 and resistance at 149.10 could open the path toward 151.40 and the long-term downtrend line at 152.50.
In the negative scenario, a drop below 145.70 may expose support at the 200-week SMA near 142.00, and further downside could test the critical 139.80 level that could act as a turning point.
Looking ahead to Q4 2025, forecasts suggest a bearish bias for USDJPY, with expectations of a decline toward 139.80 by year-end. This outlook is driven by continued Fed easing, soft US economic data, and potential yen strength if the BoJ adopts a more hawkish tone.
In conclusion, while short-term consolidation persists, the broader trend favors yen appreciation, especially if US rate cuts accelerate and Japan’s policy stance shifts.
Author

Melina joined XM in December 2017 as an Investment Analyst in the Research department. She can clearly communicate market action, particularly technical and chart pattern setups.


