USD/JPY Forecast: Trump cannot trump the dollar, GDP eyed now
- The USD/JPY moved up in range on Trump-related events
- The second read of US GDP stands out in the last week of August.
- The technical charts show a balanced picture for the pair and the FX Poll shows a slight bullish tendency in the short and medium terms.

This was the week: Trump vs. the Fed, the former fixer, China
Mid-summer was not a quiet time for US President Donald Trump that rocked markets. Trump kicked off the week by criticizing the Federal Reserve once again, annoyed by the rate hikes. He complained that Fed Chair Jerome Powell is not a "cheap debt man." That sent the greenback down.
On Tuesday, Trump was the center of attention and needed to defend himself. His former lawyer and "fixer" Michael Cohen testified against Trump. Cohen said Trump instructed him to pay hush money to two lovers to influence the campaign. Former campaign manager Paul Manafort was convicted of several crimes and faces another trial. He may flip against Trump as well.
More: How to trade a Trump impeachment in 3 phases with the US Dollar
Wednesday saw the release of the FOMC Meeting Minutes. Unmoved by Trump, the Fed conveyed an optimistic message and are set to raise rates in September.
On the trade front, the enthusiasm from the US-Chinese talks in Washington faded. The Administration went ahead with imposing tariffs on $16 billion worth of Chinese goods, as planned. China retaliated. According to Trump's latest comments, the negotiations have no chance of succeeding. Duties on a whopping $200 billion are on the cards.
US data was somewhat disappointing. Sales of existing homes fell for the fourth consecutive months, a streak last seen in 2013. Markit's preliminary forward-looking PMI for August unexpectedly dropped. New home sales fell as well.
Late in the week, Fed Chair Jerome Powell saw no signs of an overheating of the economy nor accelerating inflation, weighing on the USD.
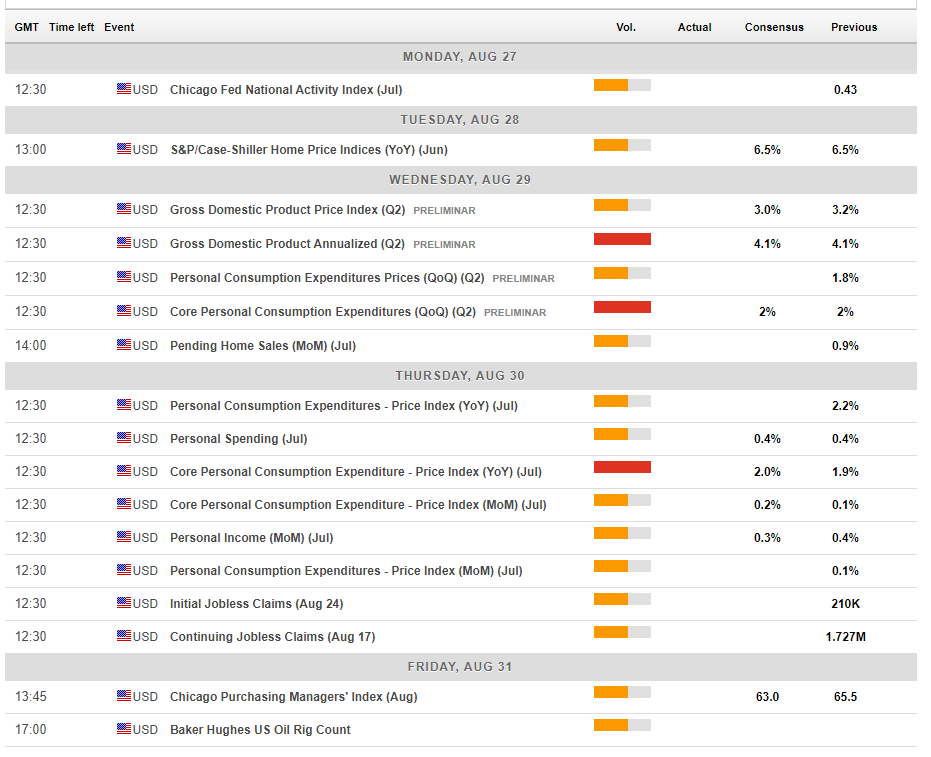
US events: Second read of US GDP
The first significant event of the week is the S&P Case Shiller Home Price Index. The housing sector is gaining traction after the recent slides in existing and new home sales.
The central event of the week is the second release of GDP growth data for Q2 2018 on Wednesday. The initial release saw an impressive growth rate of 4.1%, the best in four years. President Trump took a victory lap on the data. Revisions are quite frequent, and the figure could surprise in both directions.
Apart from the headline, watch out for the various components. Rising exports and investment are positive developments while inventories and government spending are unattractive areas of growth.
The Fed's favorite inflation figure is published on Thursday. The Core PCE Price Index dropped to 1.9% in June despite a parallel rise in the Core CPI. Different methodologies explain the differences. This time, the increase of the Core CPI to 2.4% in July will likely drag the Core PCE higher with it. Besides, personal consumption and income are also released at this time.
Friday may see some end-of-month scrambling.
Here are the top US events as they appear on the forex calendar:
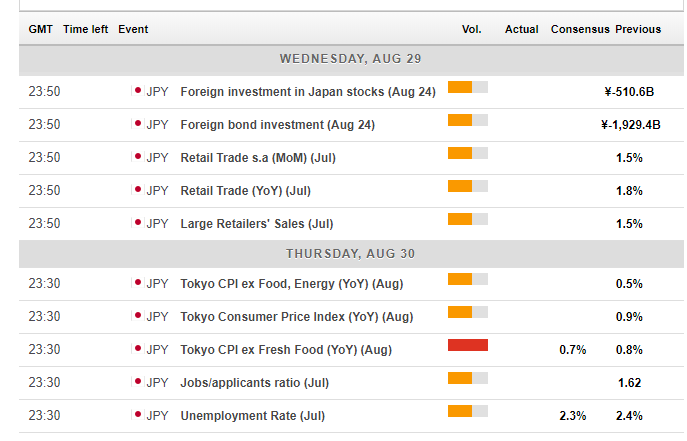
Japan: Inflation data and reaction to stocks
Japanese trade figures will be of interest on Wednesday, but the focus highlight of the calendar is the inflation data for the capital region of Tokyo on Thursday. Excluding fresh food, prices are up 0.8% YoY, and we may see a deceleration now.
The national release later mimics the publication for Tokyo. The increase is well below the BOJ's 2% target, and the central bank will likely continue easing for a long time.
As usual, the pair also reflects movements in stock markets. The Yen is usually a safe-haven currency but does not always work as such. The USD/JPY is better correlated with stocks and the general ebb and flow of the US Dollar.
Here are the events lined up in Japan:
USD/JPY Technical Analysis
The USD/JPY is trading within a downtrend channel, marked by thick black lines on the chart. On the other hand, the recent moves sent the pair above the 50-day Simple Moving Average, a bullish sign. The Relative Strength Index and Momentum are balanced.
111.40 capped the USD/JPY in mid and late August, as well as back in mid-May. 112.15 was a peak in the wake of August and 113.15 was the top point in July.
110.55 was the low point in late July. Further down, 110.10 was a swing low in mid-August. Below 110.00 we see 119.80 as the low point in late August, followed by 109.40, a stubborn line in late June.
-636706974157813367.png)
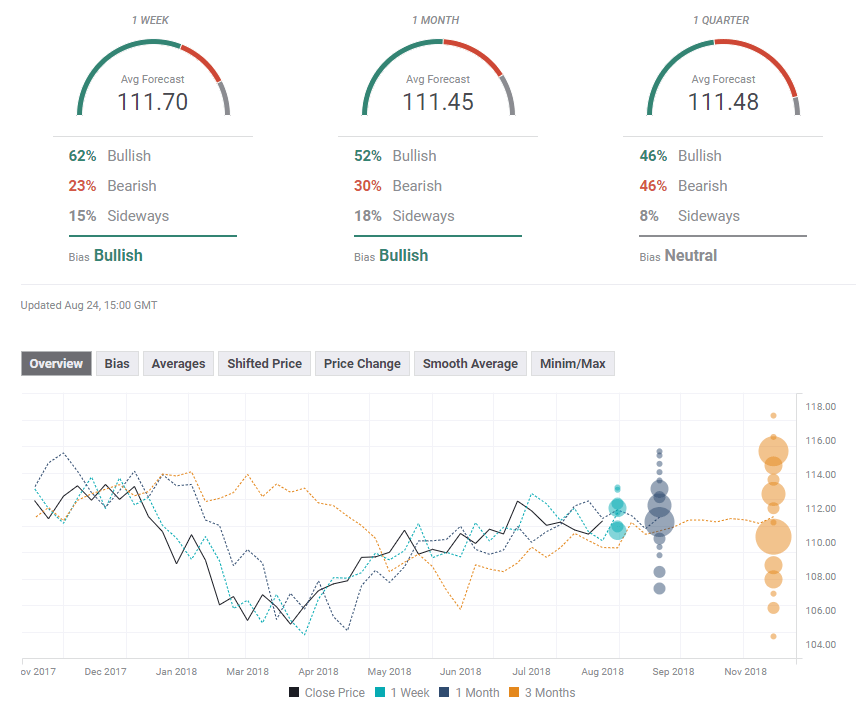
USD/JPY Sentiment
On the one hand, the US Dollar remains king. On the other side, growing trade tensions could weigh on stock markets, triggering flows into the safe-haven yen. A confirmation of US GDP should keep the US Dollar bid. All in all, the pair could hold onto current levels before choosing a direction closer to the planned US imposition of new tariffs.
The FXStreet forex poll of experts shows a bullish tendency in the short and medium terms. Both have received upgrades. In the long-term, the trend is neutral and the levels are little changed from the previous forecast.
Related Forecasts
Author

Yohay Elam
FXStreet
Yohay is in Forex since 2008 when he founded Forex Crunch, a blog crafted in his free time that turned into a fully-fledged currency website later sold to Finixio.


