USD/JPY Forecast: oversold on Intraday charts, Yen undervalued as per BIS REER

The Dollar-Yen pair dropped to a low of 112.45 on Monday as markets continued to offer the US dollar in response to last week’s dovish Fed rate hike. Fed policymakers talked about a potential for three or more rate hikes in 2017, but the comments failed to lift the US dollar. Fed’s Harker also talked about reducing the Fed’s balance sheet, but the dollar failed to regain the poise.
The currency pair extended yesterday’s losses to a low of 112.26 in early Asia before recovering to 112.80 levels. This appears to be a chart driven recovery as the treasury yields continue to trade flat.
4-Hour chart - Bullish price RSI divergence
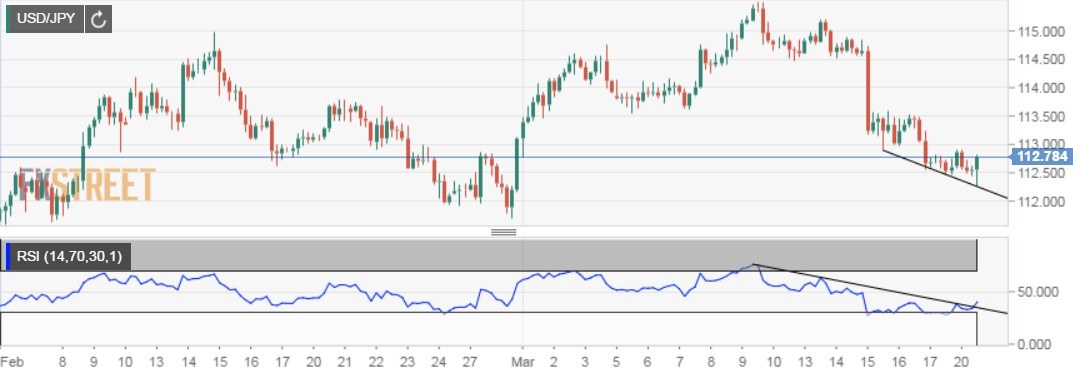
- The bullish price RSI divergence, coupled with the breach of downtrend on the RSI suggests the technical recovery could be extended to 113.44 (200-DMA).
Daily chart - Potential rounding bottom
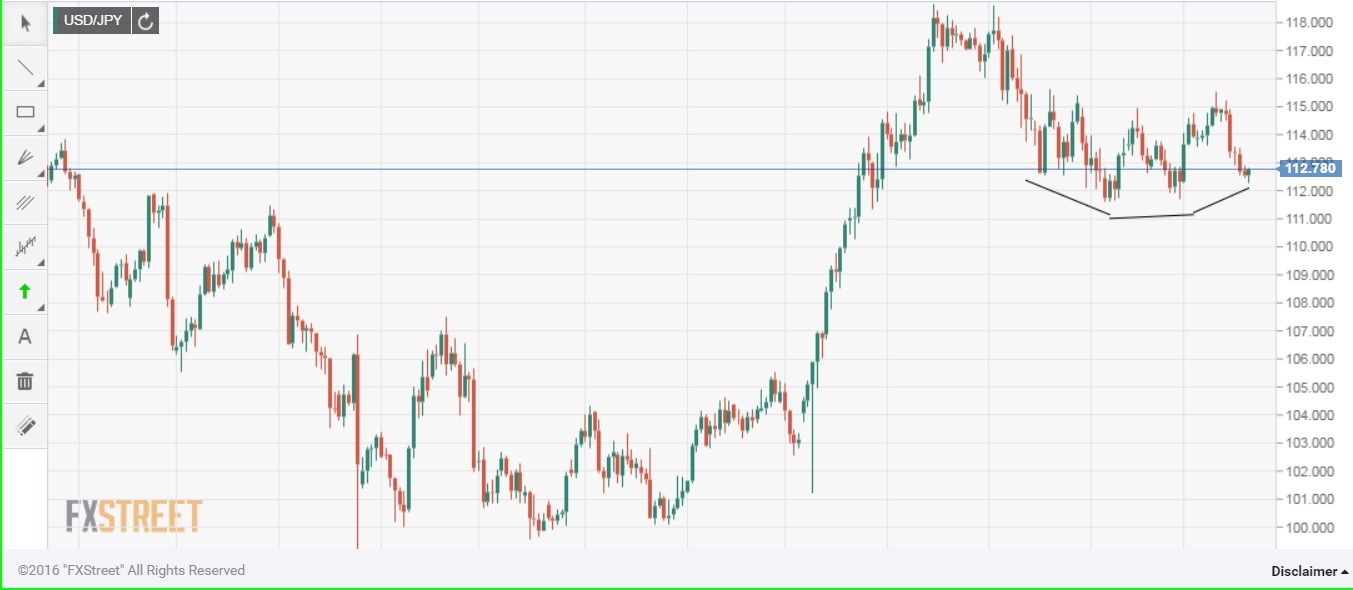
- The spot could be forming a rounding bottom formation. Interestingly, the current pattern is very similar to the one we saw in the June to October period.
- Today’s uptick needs a bullish follow through. A break above the resistance zone around 114.00 would increase the odds of the pair forming a rounding bottom pattern.
- Bearish scenario - On the downside, only a daily close below 111.60 would signal the continuation of the retreat from the December 2016 high of 118.66 levels.
BIS REER indicates Yen is undervalued
BIS effective exchange rate real (CPI-based), Broad Indices Monthly averages; 2010=100 released by the Bank for International Settlements every month on 16/17th
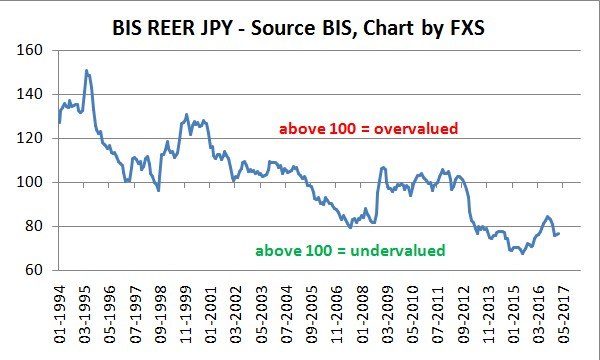
- The above chart clearly shows the Japanese Yen is significantly undervalued in the long-run. It suggests potential for a recovery and goes well with the fact that Japan runs a huge current account surplus. Moreover, huge current account surplus usually leads to a strong currency.
REER contradicts bullish reversal - inverse head and shoulder pattern on the monthly chart
Monthly chart
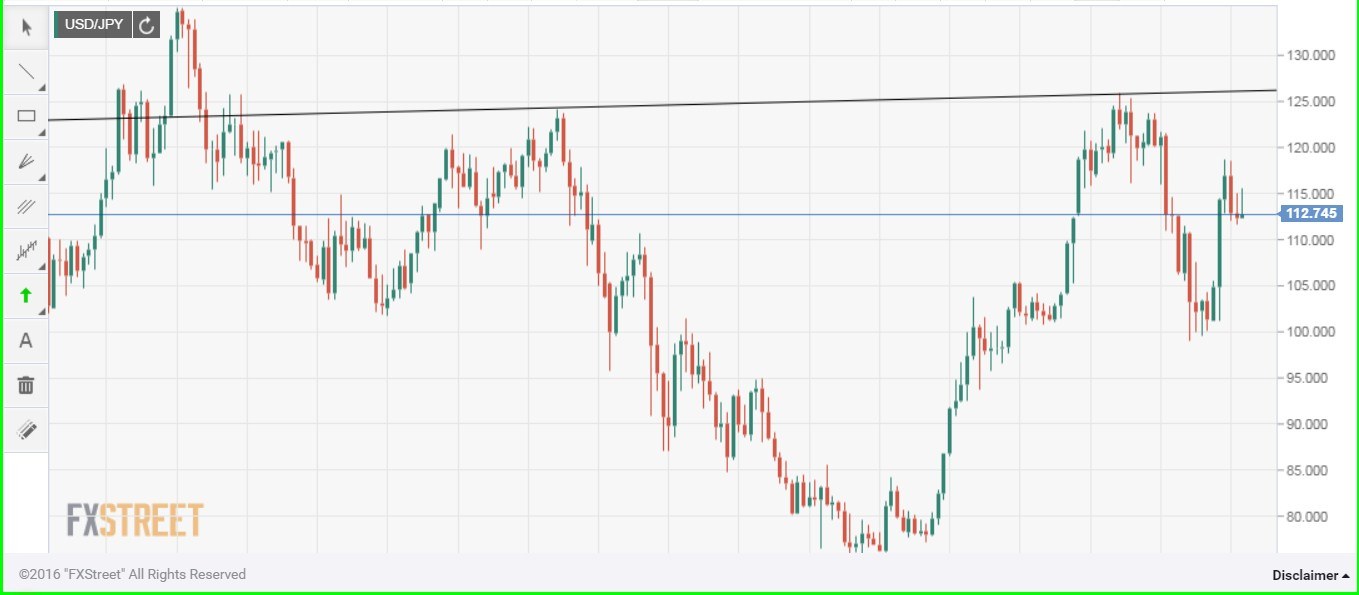
REER shows Yen is undervalued (could strengthen in the long-run), however, USD/JPY monthly chart shows a bullish reversal - inverse head and shoulder pattern. A break above the neckline resistance level seen around 126.00 would open doors for 150.00 levels.
Author

Omkar Godbole
FXStreet Contributor
Omkar Godbole, editor and analyst, joined FXStreet after four years as a research analyst at several Indian brokerage companies.


