Having closed below 108.00 on Tuesday, the USD/JPY pair extended the losses to 106.30  today - the lowest level since November 2016. As of writing, the pair is trading around 106.64 - 38.2% Fibonacci retracement of the rally from 2011 low to June 2015 high.

Yen bid as yields rising for all the wrong reasons?

It is worth noting that rally in the JPY seen in the last 12 hours contradicts the post-US CPI uptick in the treasury yields. Also, the resilience shown by US stocks (to rising yields) failed to keep Yen bulls at bay.

This could be an indication the yields are rising for all the wrong reasons - fiscal profligacy. Further, the dip in the Japanese Yen crosses could be warning the markets are heading towards another round of risk aversion.   

Aso talks down need for FX intervention

The Japanese Yen has appreciated close to 6 percent in the last five days, hence speculation is on the rise that the Bank of Japan (BOJ) and Japanese government may act, however, earlier today Finance Minister Aso talked down the need for FX intervention. So, Yen bulls have little reason to fear.

That said, the spot is looking oversold, and could see a corrective rally in the short-term, according to technical charts.

Monthly chart - Pair flirts with a confluence of key fib levels

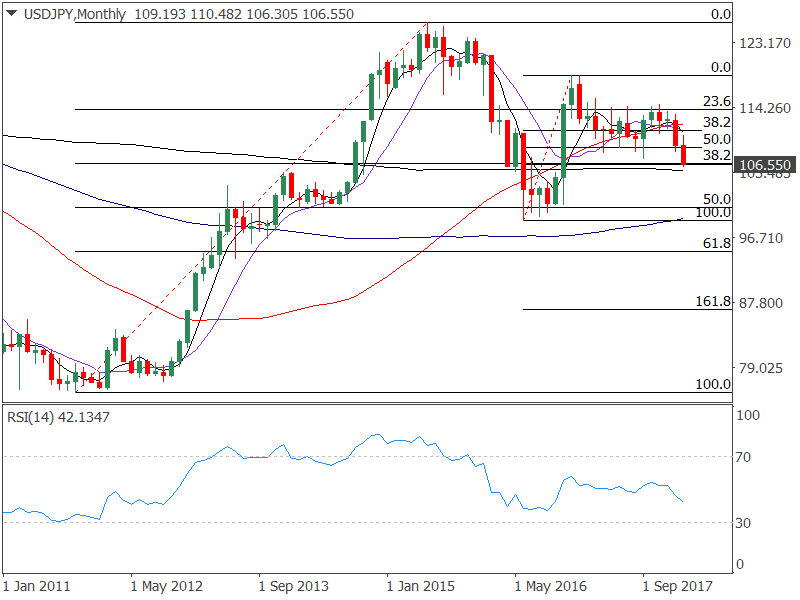
  • The pair is trading around key fib levels: 106.48 - 61.8% Fibonacci retracement of rally from 2016 low - December 2016 high, 106.59 - 38.2% Fibonacci retracement of rally from 2011 low - 2015 high.
  • The relative strength index (RSI) is biased bearish.

Daily chart - RSI points to corrective rally

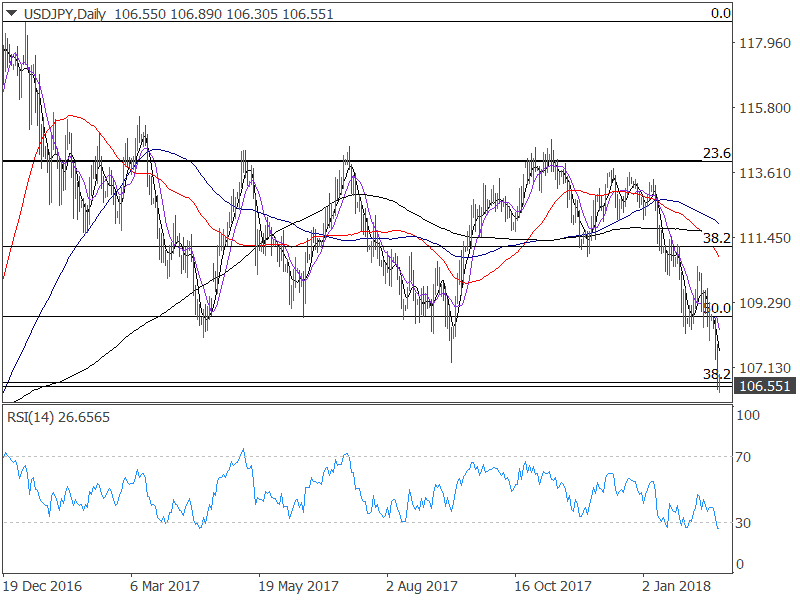
  • Throughout the bear run (from Dec 2016 high till date) the RSI below 30.00 has yielded a technical correction.

4-hour chart - signs of bullish divergence

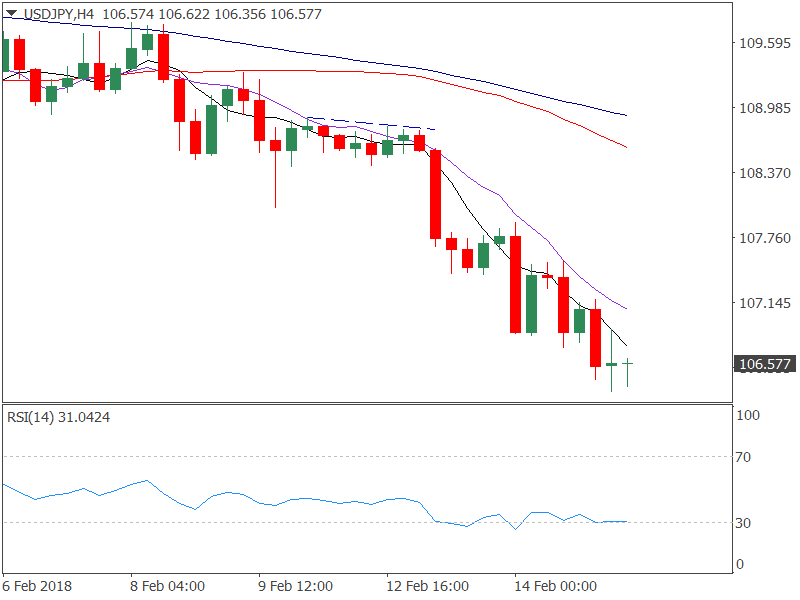
The pair has been creating lower lows, but the RSI has diverged, indicating the bearish move is weakening. It adds credence to the idea of short-term correction put forward by the daily RSI.

View

  • A corrective rally looks likely, with immediate upside capped around the downward sloping 1-hour 50-MA (currently seen at 107.35.
  • Only a close above 108.25 (Jan. 26 low) would signal a short-term bottom is in place and may allow for a stronger gain towards 109.70-110.00 levels.
  • Meanwhile, failure to capitalize on signs of bullish divergence on 4-hour chart (4-hour close below 106.30) could push the spot down to 105.72 (monthly 200-MA).

Information on these pages contains forward-looking statements that involve risks and uncertainties. Markets and instruments profiled on this page are for informational purposes only and should not in any way come across as a recommendation to buy or sell in these assets. You should do your own thorough research before making any investment decisions. FXStreet does not in any way guarantee that this information is free from mistakes, errors, or material misstatements. It also does not guarantee that this information is of a timely nature. Investing in Open Markets involves a great deal of risk, including the loss of all or a portion of your investment, as well as emotional distress. All risks, losses and costs associated with investing, including total loss of principal, are your responsibility. The views and opinions expressed in this article are those of the authors and do not necessarily reflect the official policy or position of FXStreet nor its advertisers. The author will not be held responsible for information that is found at the end of links posted on this page.

If not otherwise explicitly mentioned in the body of the article, at the time of writing, the author has no position in any stock mentioned in this article and no business relationship with any company mentioned. The author has not received compensation for writing this article, other than from FXStreet.

FXStreet and the author do not provide personalized recommendations. The author makes no representations as to the accuracy, completeness, or suitability of this information. FXStreet and the author will not be liable for any errors, omissions or any losses, injuries or damages arising from this information and its display or use. Errors and omissions excepted.

The author and FXStreet are not registered investment advisors and nothing in this article is intended to be investment advice.

Recommended Content


Recommended Content

Editors’ Picks

EUR/USD clings to daily gains above 1.0650

EUR/USD clings to daily gains above 1.0650

EUR/USD gained traction and turned positive on the day above 1.0650. The improvement seen in risk mood following the earlier flight to safety weighs on the US Dollar ahead of the weekend and helps the pair push higher.

EUR/USD News

GBP/USD recovers toward 1.2450 after UK Retail Sales data

GBP/USD recovers toward 1.2450 after UK Retail Sales data

GBP/USD reversed its direction and advanced to the 1.2450 area after touching a fresh multi-month low below 1.2400 in the Asian session. The positive shift seen in risk mood on easing fears over a deepening Iran-Israel conflict supports the pair.

GBP/USD News

Gold holds steady at around $2,380 following earlier spike

Gold holds steady at around $2,380 following earlier spike

Gold stabilized near $2,380 after spiking above $2,400 with the immediate reaction to reports of Israel striking Iran. Meanwhile, the pullback seen in the US Treasury bond yields helps XAU/USD hold its ground.

Gold News

Bitcoin Weekly Forecast: BTC post-halving rally could be partially priced in Premium

Bitcoin Weekly Forecast: BTC post-halving rally could be partially priced in

Bitcoin price shows no signs of directional bias while it holds above  $60,000. The fourth BTC halving is partially priced in, according to Deutsche Bank’s research. 

Read more

Week ahead – US GDP and BoJ decision on top of next week’s agenda

Week ahead – US GDP and BoJ decision on top of next week’s agenda

US GDP, core PCE and PMIs the next tests for the Dollar. Investors await BoJ for guidance about next rate hike. EU and UK PMIs, as well as Australian CPIs also on tap.

Read more

Majors

Cryptocurrencies

Signatures