|

USD/JPY Forecast: Monthly chart is flashing bull breakout, 120 ahead?

The USD/JPY rally is in its nascent stages and the pair could rise well above 120.00 in the next 12 months,  the robust structure on the monthly chart indicates.

As of writing, the currency pair is trading at 113.58 - the highest level since November 2017 - having found acceptance above the 200-week moving average of 113.20.

Technically speaking, the rally seen this month has likely set the tone for a completion of the long-term inverse head-and-shoulders bullish reversal pattern.

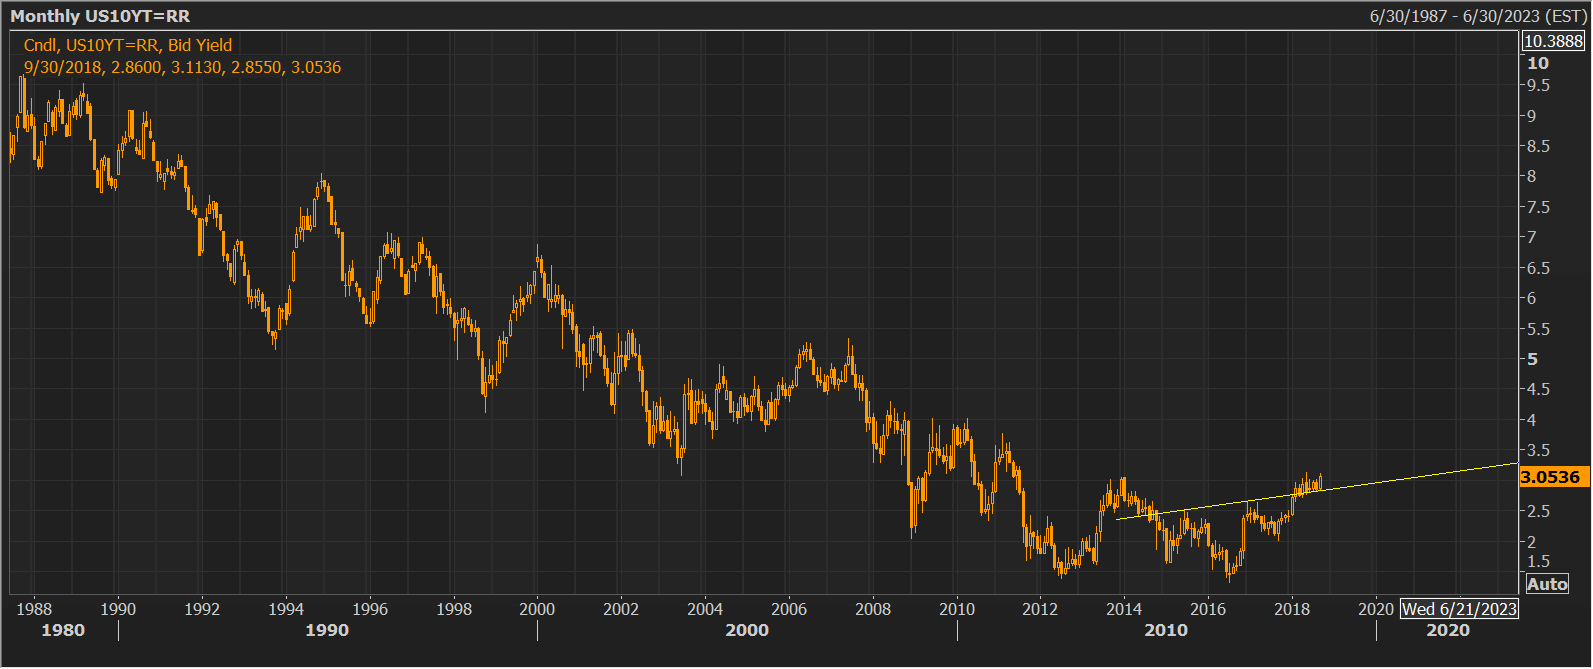
Monthly chart: USD/JPY and 10-year treasury yield

The pennant breakout seen in the USD/JPY monthly chart indicates a resumption of the rally from the September 2012 low of 77.13. The bull pattern also adds credence to the golden cross -a bullish crossover between the 50-month and 200-month moving averages (MAs) - confirmed two years ago.

What's more, the relative strength index, is biased toward the bulls and the 5-month and 10-month MAs are trending north, indicating a bullish setup.

And last but not the least, the 10-year treasury yield has likely carved out a long-term bearish-to-bullish trend change, as indicated by the inverse head-and-shoulders breakout.

Hence, it seems safe to say that the pair could rise toward the large inverse head-and-shoulders neckline resistance, currently located around 126.50, in the next 12 months.

The bullish outlook would be invalidated if the pair finds acceptance below the previous month's low of 109.76.

Author

Omkar Godbole

Omkar Godbole

FXStreet Contributor

Omkar Godbole, editor and analyst, joined FXStreet after four years as a research analyst at several Indian brokerage companies.

More from Omkar Godbole
Share:

Editor's Picks

EUR/USD flat lines below 1.1900; divergent Fed-ECB expectations offer support

The EUR/USD pair struggles to capitalize on the overnight bounce from the 1.1835-1.1830 region and oscillates in a narrow band during the Asian session on Thursday. Spot prices currently trade around the 1.1875 area, remaining nearly unchanged for the day and staying within striking distance of an over one-week high, reached on Tuesday, amid mixed cues.

GBP/USD slips heading into the Thursday trading window

The Pound Sterling pulled back from four-year highs on Wednesday, weighed down by a combination of Bank of England dovishness and UK political uncertainty, even as the US Dollar weakened on soft labor market revisions. 

Gold posts modest gains above $5,050 as US-Iran tensions persist despite strong labor data

Gold price trades in positive territory near $5,060 during the early Asian session on Thursday. The precious metal edges higher despite stronger-than-expected US employment data. The release of the US Consumer Price Index inflation report will take center stage later on Friday. 

Bitcoin holds steady despite strong US labour market

Bitcoin briefly bounced from $66,000 to above $68,000 but slightly reversed those gains following Wednesday's US January jobs report. The top crypto is hovering around $67,000, down 2% over the past 24 hours as of writing on Wednesday.

The market trades the path not the past

The payroll number did not just beat. It reset the tone. 130,000 vs. 65,000 expected, with a 35,000 whisper. 79 of 80 economists leaning the wrong way. Unemployment and underemployment are edging lower. For all the statistical fog around birth-death adjustments and seasonal quirks, the core message was unmistakable. The labour market is not cracking.

XRP sell-off deepens amid weak retail interest, risk-off sentiment

Ripple (XRP) is edging lower around $1.36 at the time of writing on Wednesday, weighed down by low retail interest and macroeconomic uncertainty, which is accelerating risk-off sentiment.