USD/JPY Forecast: Eyes 105.00 as correlation with 10yr yield spread strongest in 12 months

The USD/JPY pair is currently trading at a two-week low of 108.75 and could revisit 105.00 in the next few months as the Fed's dovish turn has left the doors wide open for a sharp narrowing of the spread between the US and Japan 10-year yield spread (US10Y-JP10Y)
More importantly, 30-day correlation coefficient between USD/JPY and the 10-year yield differential is currently seen at 0.792; the highest level since January 2018. Put simply, both are positively correlated and the correlation is the strongest in 12 months.
As of writing, the yield differential is seen at 268 basis points - the lowest level since January 2018.
US10Y-JPY10Y weekly chart
-636845155451943228.png)
As seen above, the expanding sideways channel has been breached to the downside. The 14-week RS is also reporting bearish conditions with a below -50 reading.
The spread, therefore, risks falling to 258 basis points in the USD-negative manner. That level marks a confluence of the rising trendline and the 100-day MA.
As noted above, USD/JPY and the yield spread are positively correlated. Hence, the breakdown of the yield differential could end up dragging the USD/JPY lower.
Interestingly, USD/JPY's technical chart is also biased toward the bears.
USD/JPY daily chart
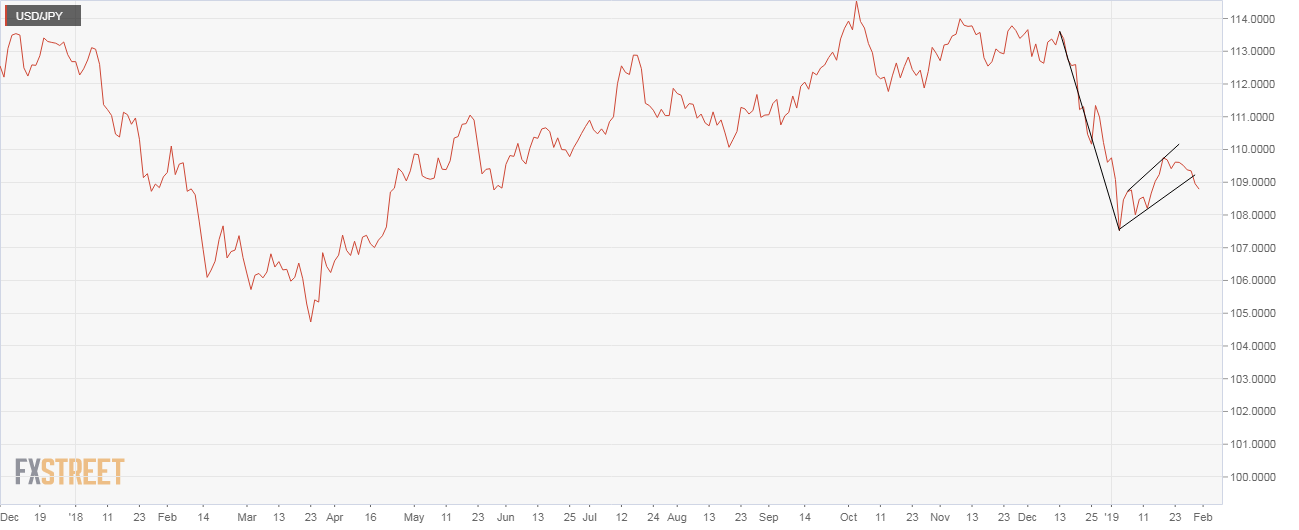
The bear flag breakdown seen in the above chart indicates the sell-off from December 2018 highs above 113.00 has resumed and the pair could go as low as 103.10 (target as per the measured height method, that is, pole length subtracted from breakdown price).
All-in-all, the pair could at least test recent lows below 105.00 in the next few weeks. The bearish view would be invalidated above 110.00.
Author

Omkar Godbole
FXStreet Contributor
Omkar Godbole, editor and analyst, joined FXStreet after four years as a research analyst at several Indian brokerage companies.


