USD/JPY Forecast: Bearish Doji reversal likely
- Previous’ doji candle makes today’s close pivotal.
- Bearish doji reversal likely as 4hr chart shows a negative divergence of the RSI.

The much-needed technical correction in the USD/JPY pair will likely gather pace today, technical charts indicate.
At press time, the currency pair is trading at 112.70 - down 0.13 percent on the day, having clocked a six-month high of 113.14 yesterday.
The pullback from 113.14 to 112.70 indicates the bulls are keen on booking profits and is likely the beginning of a deeper correction, technical charts indicate.
Daily chart
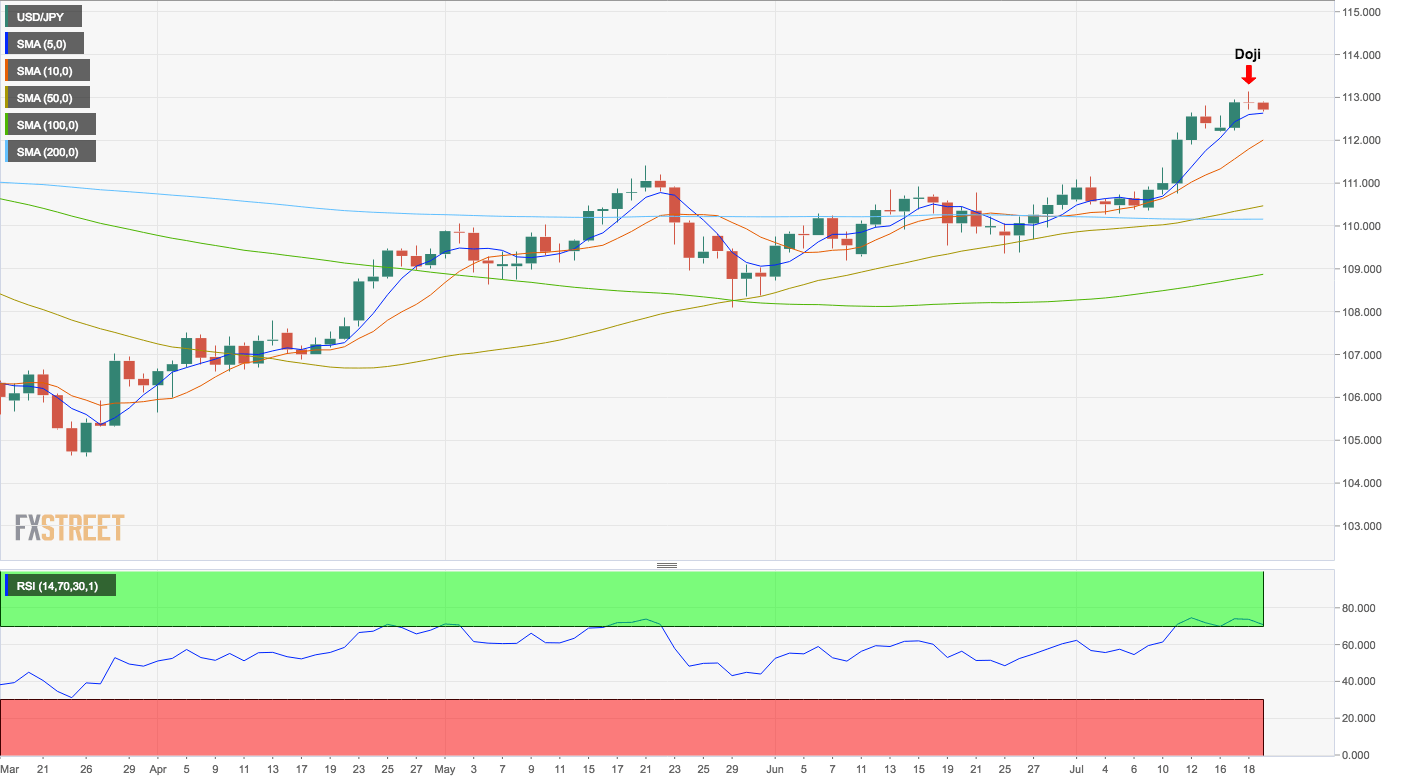
The pair created a doji candle yesterday, which usually represents indecision in the market place. However, when viewed against the backdrop of 8 percent rally from the March 26 low of 104.63, the doji candle indicates bullish exhaustion (or indecision among the bulls as the bears are already on the back foot).
Hence, the focus is on today’s UTC close. A bearish doji reversal, i.e. a short-term bullish-to-bearish trend change would occur if the spot closes below the previous day’s doji candle low of 112.71. If the reversal is confirmed, then the pair will likely revisit 111.40 (May 21 high).
On the other hand, a close today above 113.14 (previous day’s doji candle high) would signal continuation of the rally, although with the 14-day relative strength index (RSI) reporting overbought conditions, the upside could be capped around 113.27/28 (200-week moving average + 61.8% of 2017-18 slide).
That said, the short duration charts indicate a bearish doji is more like to occur than not.
4-hour chart
-636675592813582676.png)
The bearish divergence of the RSI and the head-and-shoulders breakdown on the RSI, as seen in the above chart, indicates the spot could test bids around 112.00, which marks the confluence of ascending (bullish) 10-day moving average (MA) and 50-candle MA on 4-hour chart.
Note that the path of least resistance is to the upside as the 5-day and 10-day MA are trending north. Further, major moving averages (50, 100 and 200) on the 4-hour chart are rising and are located one above the other.
Should the pair pick up a bid around 112.00, then a re-test of 113.00 cannot be ruled out.
View
- The pair risks bearish doji reversal and hence could drop to 111.40 (May 21 high) soon.
- The MAs are biased towards the bulls. Hence, I am unable to rule out the probability of a solid rebound from 112.00.
- A deeper pullback could bode well as it would help recharge the engine for a convincing break above 113.27/28 (200-week moving average + 61.8% of 2017-18 slide).
Author

Omkar Godbole
FXStreet Contributor
Omkar Godbole, editor and analyst, joined FXStreet after four years as a research analyst at several Indian brokerage companies.


