USD/JPY Elliott Wave outlook: Is wave 3 of (3) about to unfold?

USD/JPY has recently shown a textbook Elliott Wave formation, offering clues that a major directional move could be setting up. After a clear five-wave decline and a corrective recovery, the market may now be preparing to enter a powerful third wave to the downside. Let’s explore the current wave structure, supported by Fibonacci retracements, and evaluate what could come next.
Wave structure: Setup for a bearish third wave
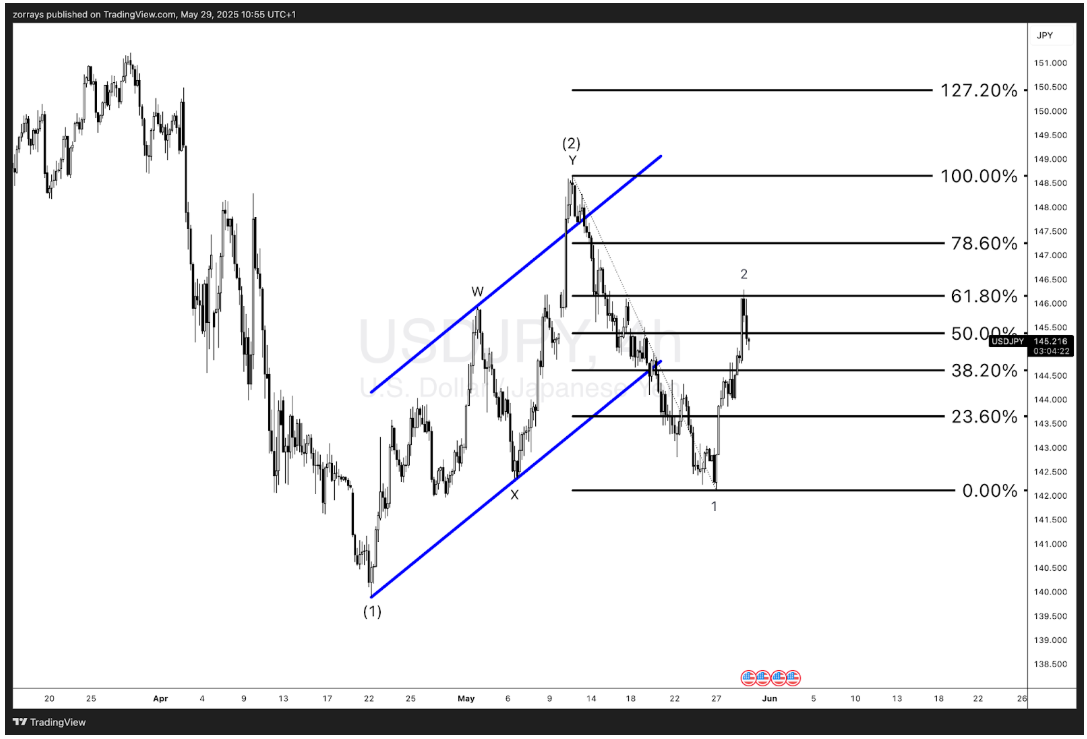
The overall count suggests that USD/JPY completed a corrective WXY structure up to the recent high marked as Wave (2). Since then, we have seen a decisive move lower that counts well as Wave 1 of a new bearish cycle.
A bounce followed, and this retracement aligns well with typical Wave 2 behavior:
- Wave 2 reached the 61.8% Fibonacci retracement level of Wave 1 — a classic reaction point in Elliott Wave theory.
- Price showed strong rejection from this level, indicating potential exhaustion of the retracement.
Given this rejection and resumption of bearish momentum, we may now be witnessing the early stages of Wave (3) to the downside — historically the most powerful and extended wave in an impulsive structure.
Key implications
- If confirmed, Wave (3) could lead to accelerated price depreciation.
- Bearish conviction strengthens if price breaks below the 144.00 level — potentially the termination of Wave B in the corrective structure.
What to watch: Confirmation or correction?
While the setup favors a bearish continuation, caution is warranted until confirmation is received. There are two main scenarios traders should monitor:
- Bearish continuation:
- If price breaks below the 144.00 level, it would serve as the first clue of downward continuation.
- This could suggest the onset of Wave 3 of (3), opening the door for deeper downside.
- Extended correction:
- Alternatively, the market could still be within a complex corrective Wave 2 structure.
- A push back above the 61.8% retracement (~146.50) would weaken the immediate bearish outlook and delay the third wave thesis.
Key levels
- Support: 144.00 (potential break of Wave B).
- Resistance: 146.00, 146.50 (retracement ceiling).
Summary
USD/JPY appears to be setting the stage for a significant bearish Wave (3) after rejecting the 61.8% retracement level during a potential Wave 2 pullback. The first major clue toward confirmation would come with a break below the 144.00 level. Until then, traders should remain vigilant and responsive to price action as it unfolds.
As always, combining Elliott Wave analysis with risk management and broader market context is crucial for capitalizing on the next major move.
Author

Zorrays Junaid
Alchemy Markets
Zorrays Junaid has extensive combined experience in the financial markets as a portfolio manager and trading coach. More recently, he is an Analyst with Alchemy Markets, and has contributed to DailyFX and Elliott Wave Forecast in the past.


