USD/JPY Bullish Breakout Above 110 Confirms Wave C Impulse

The USD/JPY made a bullish breakout above the resistance trend line (dotted red), which is confirming the development of a wave C (pink) towards the Fibonacci targets.
4 hour chart
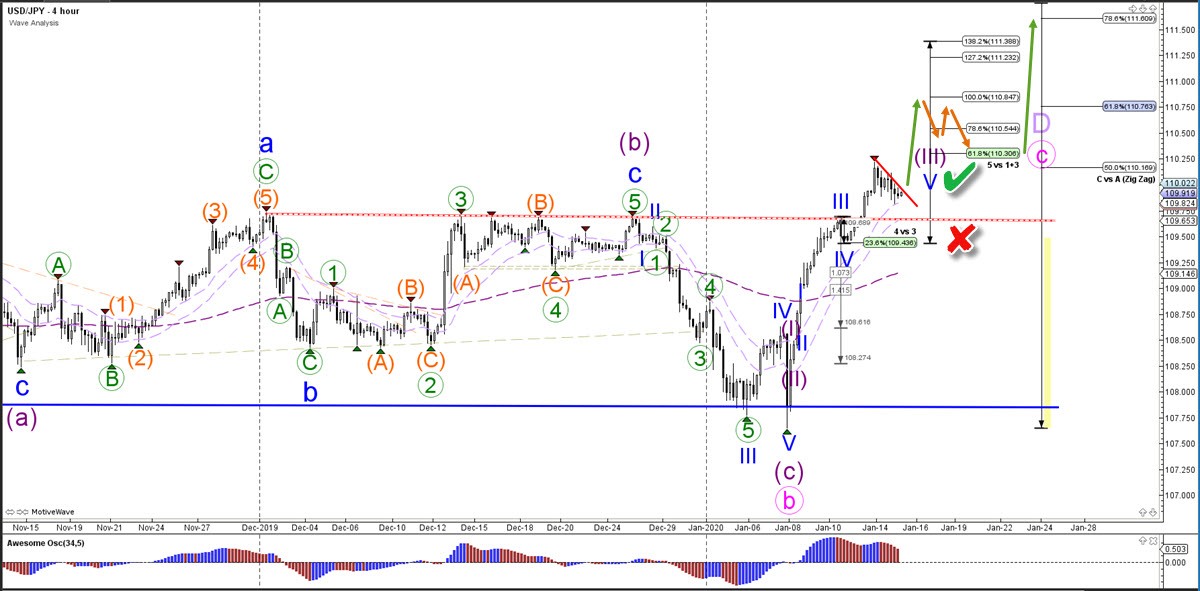
The USD/JPY is building a retracement after the breakout. A continuation above the minor resistance trend line (red) could confirm (green check) the wave 3 (purple) pattern and indicate a push higher towards the Fibonacci targets. A rebreak below the broken resistance (dotted red) invalidates (red x) the wave outlook.
1 hour chart
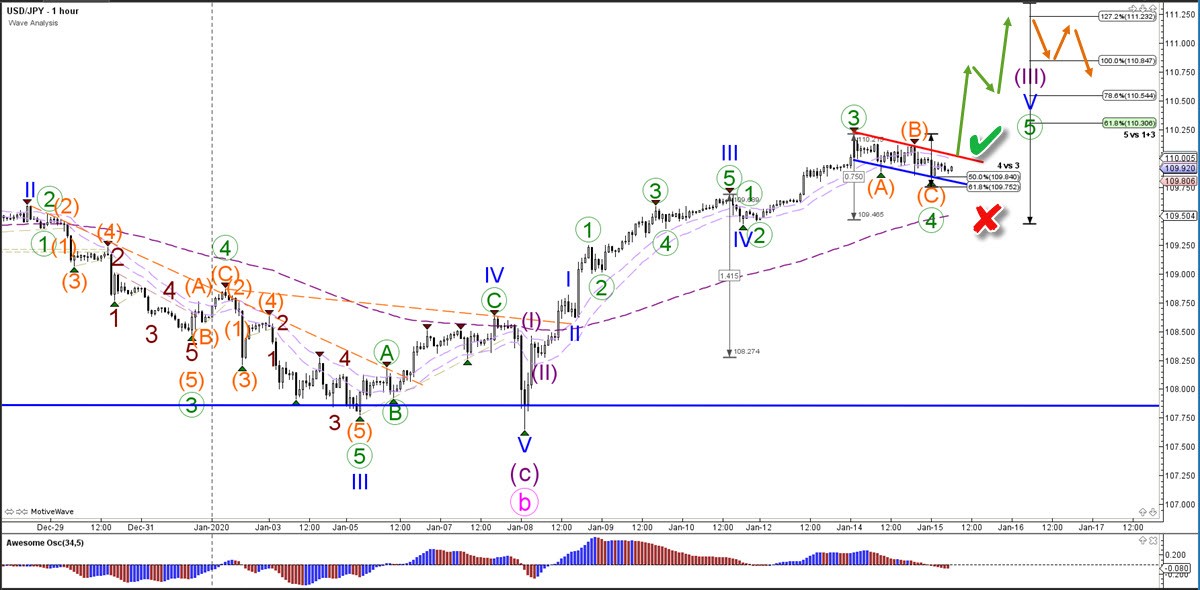
The USD/JPY bullish bounce at the Fibonacci retracement levels of wave 4 vs 3 and breakout above the resistance trend line (red) could confirm (green check) the wave 4 (green) retracement and wave 3 (purple) momentum. A break, however, below the 61.8% Fibonacci retracement level invalidates (red x) this wave outlook.
The analysis has been done with the CAMMACD.Core System.
For more daily technical and wave analysis and updates, sign-up up to our ecs.LIVE channel.
Author

Chris Svorcik
Elite CurrenSea
Experience Chris Svorcik has co-founded Elite CurrenSea in 2014 together with Nenad Kerkez, aka Tarantula FX. Chris is a technical analyst, wave analyst, trader, writer, educator, webinar speaker, and seminar speaker of the financial markets.


