USD/JPY Bearish Breakout Below Bullish Trend Channel

Meta description: The USD/JPY broke below the support line of the critical uptrend channel (dotted blue) and price is now building a bearish breakout below the 110 round level.The bearish price action could be a wave A (blue) correction within a larger wave E triangle from the daily chart.
USD/JPY
4 hour
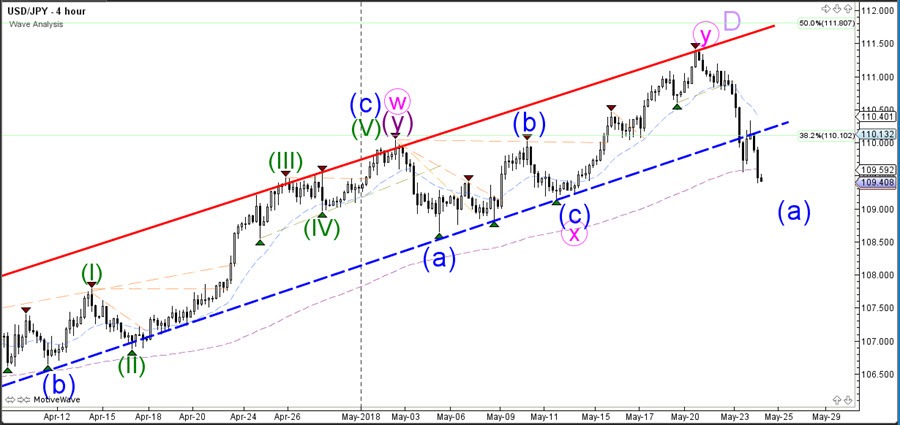
The USD/JPY broke below the support line of the critical uptrend channel (dotted blue) and price is now building a bearish breakout below the 110 round level.
The bearish price action could be a wave A (blue) correction within a larger wave E triangle from the daily chart. Price could have completed a wave Y (pink) of a wave D (light purple) at the most recent top.
1 hour
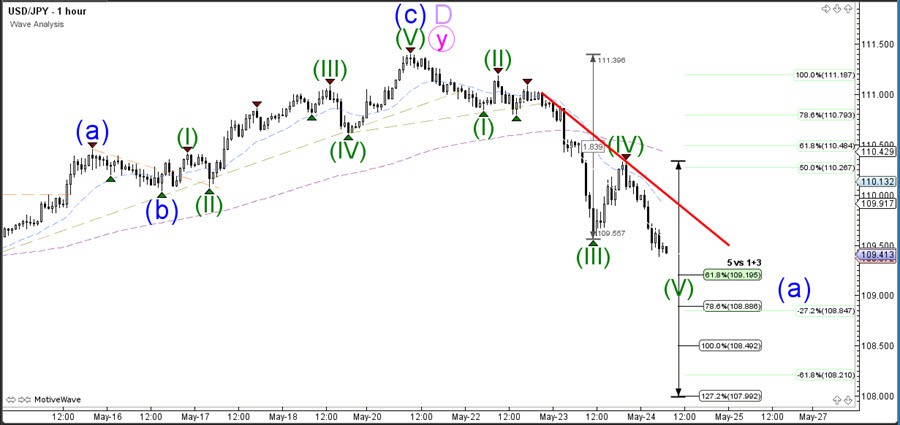
The USD/JPY made a strong bearish continuation which was a wave 3 (green) momentum. The pullback within wave 4 (green) stopped at the 50% Fibonacci retracement level and reversed back down. Price is now probably in a wave 5 (green), although the bearish price action could extend itself. Once the wave A is completed, then traders could expect an ABC correction within wave B.
Author

Chris Svorcik
Elite CurrenSea
Experience Chris Svorcik has co-founded Elite CurrenSea in 2014 together with Nenad Kerkez, aka Tarantula FX. Chris is a technical analyst, wave analyst, trader, writer, educator, webinar speaker, and seminar speaker of the financial markets.


