USD/JPY analysis: A tug-of-war between BoJ speculation and FOMC hawkishness

The USD/JPY currency pair is dancing on a tightrope, caught between two compelling narratives. On one hand, all eyes are on the Bank of Japan (BoJ) and its potential shift away from negative rates, exacerbated by weak global demand and a predicted widening of Japan's trade deficit. On the other, the US Federal Reserve's upcoming interest rate decision is casting its long shadow, with investors anticipating a hawkish tilt.
The Japanese saga
The morning brought Japanese trade data for August into focus, with forecasts suggesting a leap in trade deficit from ¥78.7 billion to a whopping ¥659.1 billion. Should this prognosis hold, it could throw cold water on any immediate plans the BoJ has for veering away from its negative interest rate policy. A less-than-stellar global macroeconomic backdrop is likely to affect labor markets, which in turn would dent wage growth and demand—two vital cogs in the BoJ's interest rate machine.
The FOMC factor
Across the Pacific, the Fed's decision on interest rates is imminent. Market sentiment leans toward the expectation of upwardly revised GDP and inflation forecasts. If the Fed serves up a hawkish feast in its FOMC economic indicators and press conference, it could trigger a USD/JPY rally.
Technical analysis
Daily chart
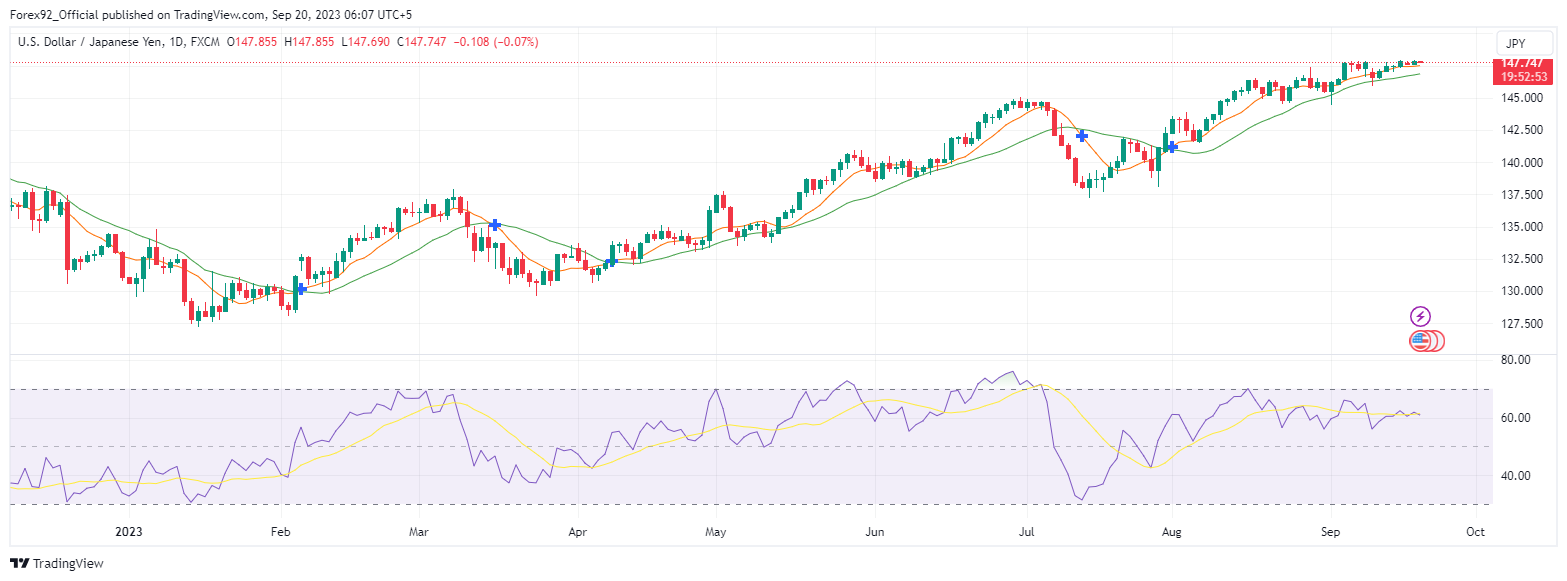
The USD/JPY is currently perched just below the critical 148.405 resistance level, while firmly staying above the 50-day and 200-day EMAs. This paints a bullish technical picture. A push toward and above 148.405 would further validate the bullish scenario. However, failing to breach this resistance may push the pair toward the 146.649 support zone.
4-hour chart
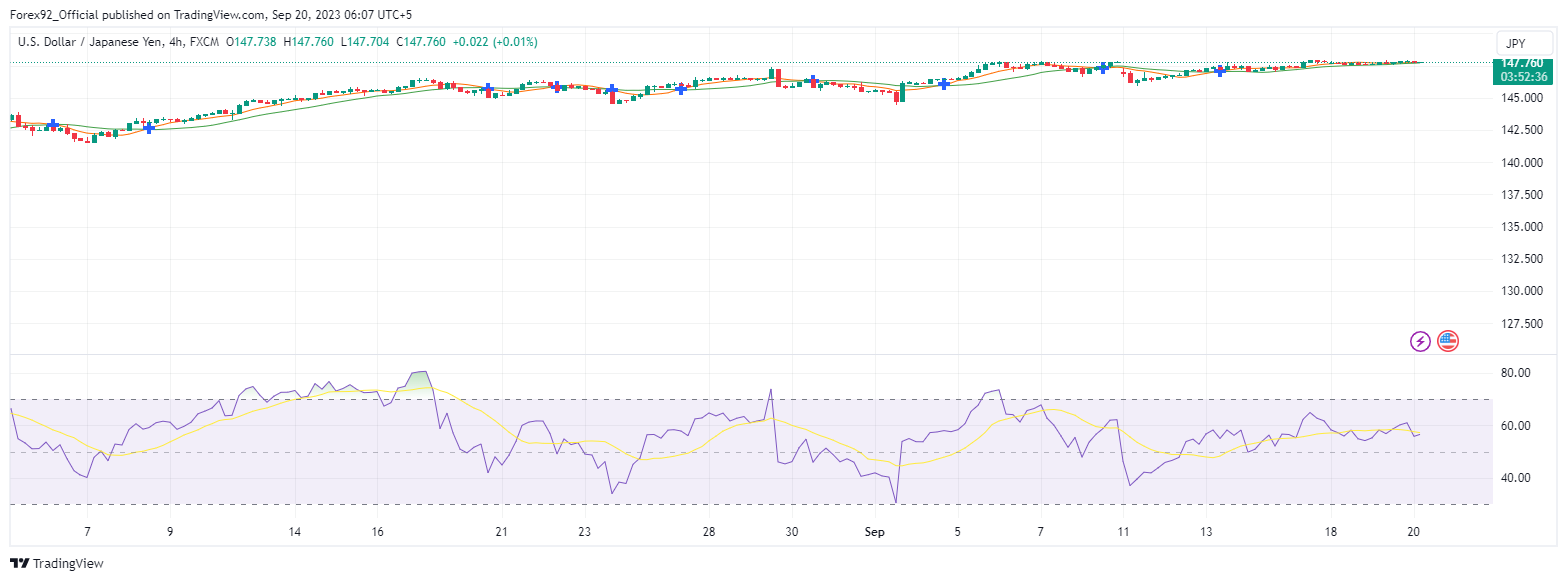
Short-term indicators on the 4-hour chart mirror the daily chart, with the USD/JPY staying above both 50-day and 200-day EMAs. Moreover, the 14-4 Hourly RSI stands at 56.18, allowing room for upward momentum before reaching overbought conditions.
Scenarios
-
Bullish Scenario: If the FOMC paints a hawkish picture and Japan's macroeconomic indicators don't turn heads, expect a USD/JPY rally that could challenge the 150.293 resistance level.
-
Bearish Scenario: If the Fed adopts a dovish stance and Japanese data stokes BoJ speculation, the 146.649 support level will be the first line of defense for the bulls, followed by 144.894 and the 50-day EMA.
The final word
The USD/JPY finds itself at the crossroads of diverging monetary policies. While traders are torn between BoJ speculation and FOMC hawkishness, technical indicators signal bullish tendencies. Nevertheless, the currency pair's direction hinges on pivotal announcements from the world's two leading central banks. Keep your eyes peeled and your strategy flexible as these market movers unfold.
Author

Usman Ahmed
Forex92
Usman Ahmed is a currency trader and financial market analyst with more than a decade of active trading experience.


