USD/CHF Elliott Wave technical analysis [Video]
![USD/CHF Elliott Wave technical analysis [Video]](https://editorial.fxsstatic.com/images/i/USDCHF-bullish-realistic_XtraLarge.png)
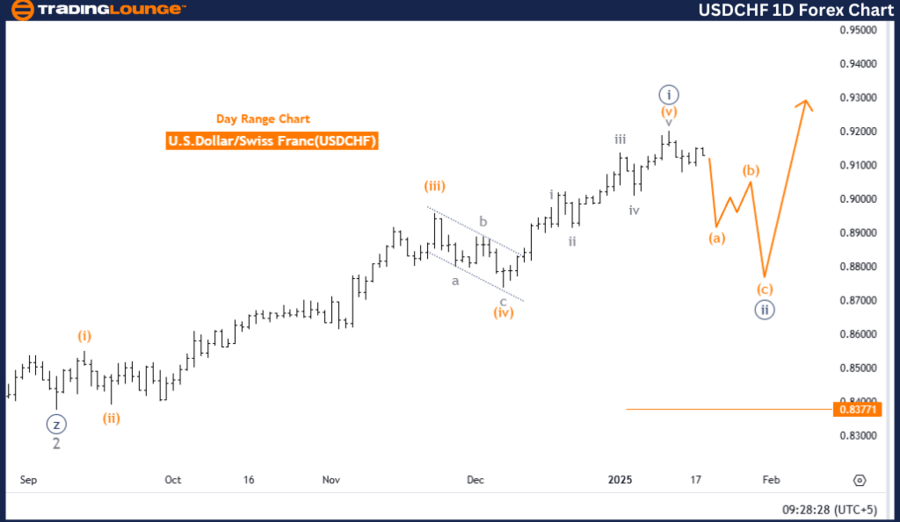
USD/CHF Elliott Wave Analysis Trading Lounge Day Chart
USD/CHF Elliott Wave technical analysis
-
Function: Counter Trend.
-
Mode: Corrective.
-
Structure: Navy Blue Wave 2.
-
Position: Gray Wave 3.
-
Direction next higher degrees: Navy Blue Wave 3.
-
Details: Navy Blue Wave 1 appears complete, with Navy Blue Wave 2 currently in progress.
-
Wave cancel invalid level: 0.83771.
The USDCHF daily chart presents a counter-trend scenario within the Elliott Wave framework. The analysis reveals a corrective phase linked to navy blue wave two, which follows the completion of navy blue wave one. This phase indicates a temporary retracement before the continuation of the broader trend.
Currently, the wave structure comprises navy blue wave two, positioned within gray wave three. This configuration reflects an ongoing multi-stage correction. The completion of navy blue wave one has initiated this corrective phase, which is expected to set the stage for the emergence of navy blue wave three.
The invalidation level is marked at 0.83771, meaning that any price movement below this level would invalidate the current wave count and require a reassessment of the analysis. As long as the price holds above this threshold, the corrective wave structure remains valid, with navy blue wave two continuing to develop.
This corrective phase suggests a consolidation period or retracement, which is typical before potential upward movement in navy blue wave three. Careful monitoring of the ongoing wave progression will provide insights into the transition to the next phase.
Conclusion
In summary, the USDCHF daily chart showcases a counter-trend correction via navy blue wave two after the completion of navy blue wave one. The structure remains in corrective mode with gray wave three progressing. The critical invalidation level of 0.83771 must be maintained to sustain the current wave count. As the corrective phase progresses, the potential for a transition to navy blue wave three is anticipated, signaling the continuation of the broader trend.
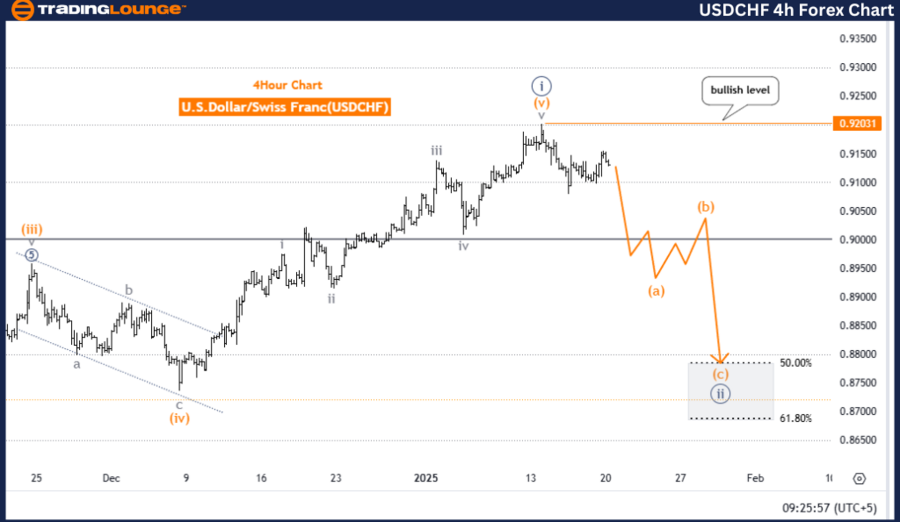
USD/CHF four-hour chart.
USD/CHF Elliott Wave technical analysis
-
Function: Counter Trend.
-
Mode: Impulsive.
-
Structure: Orange Wave A.
-
Position: Navy Blue Wave 2.
-
Direction next higher degrees: Orange Wave B.
-
Details: Navy Blue Wave 1 appears complete, with Orange Wave A of 2 currently in progress.
-
Wave cancel invalid level: 0.92031.
The USDCHF 4-hour chart presents a counter-trend movement within the Elliott Wave structure. The analysis highlights an impulsive mode, driven by orange wave A, which forms part of the broader navy blue wave two structure. This indicates a corrective phase following the completion of navy blue wave one.
Currently, orange wave A within navy blue wave two is unfolding, representing the initial stage of a typical three-wave corrective sequence. This development suggests that further movements are expected within this counter-trend phase. The completion of navy blue wave one confirms the transition into the corrective phase signified by navy blue wave two.
The invalidation level for this wave structure is set at 0.92031, meaning that any movement above this level would invalidate the current wave count, requiring a revised analysis of the Elliott Wave structure. As long as the price stays below this level, the counter-trend scenario remains valid.
Close monitoring of the ongoing development of orange wave A and subsequent waves within navy blue wave two is crucial. These insights will help determine the overall corrective pattern and its influence on the larger market trend.
Conclusion
In summary, the USDCHF 4-hour chart displays a counter-trend scenario led by orange wave A within navy blue wave two. This phase signifies a correction following the completion of navy blue wave one. The invalidation level of 0.92031 serves as a key reference point to maintain the accuracy of the wave count. As long as the price remains below this threshold, the counter-trend pattern is expected to persist, with orange wave A continuing to shape the corrective sequence.
USD/CHF Elliott Wave technical analysis [Video]
Author

Peter Mathers
TradingLounge
Peter Mathers started actively trading in 1982. He began his career at Hoei and Shoin, a Japanese futures trading company.


