USD/CAD slips as bears press 1.3980 – Focus turns to US durables, housing and auctions

Executive summary
-
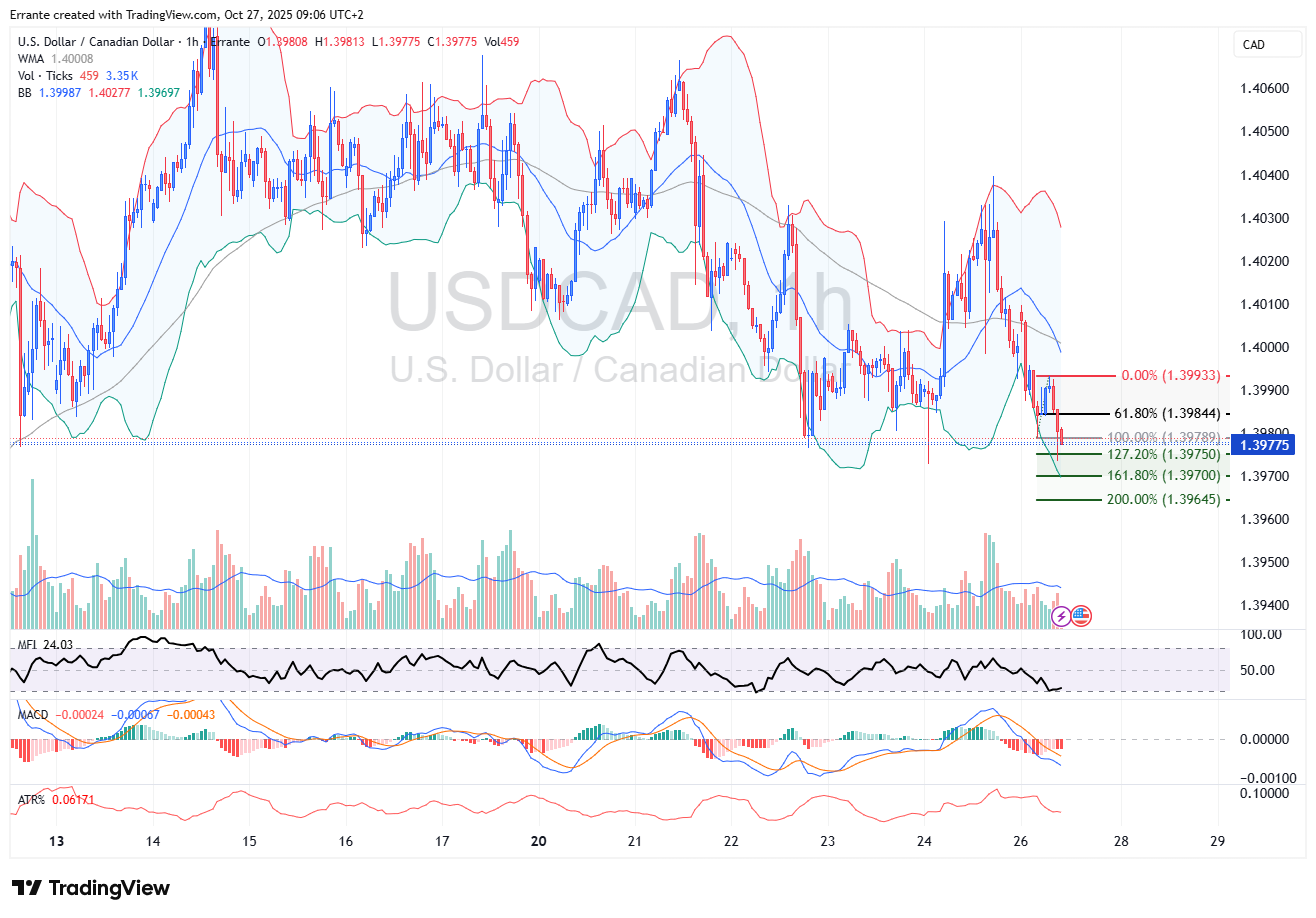
The hour-chart shows a clean bearish rotation beneath the 50-period weighted moving average with price pinned under a Fibonacci cluster at 1.3984/1.3979. Momentum and breadth point to continuation lower toward 1.3975, 1.3970, 1.3965, while volatility stays compressed into the U.S. data window.
-
Today’s U.S. calendar (durable goods, new home sales, Treasury supply) is the main driver. With no first-tier Canadian releases on deck, the Canadian dollar takes its cues from the U.S. data impulse and intraday oil swings.
-
The baseline expects a modest USD fade on soft durables or firm new-home prints, extending the dip toward 1.3965; a topside surprise would negate below 1.3990/1.4000.
Market overview
The North American session lines up a classic USD/CAD day: a quiet Canadian tape set against an event-heavy U.S. calendar. The near-term narrative is less about a sudden shift in Canadian macro and more about how the U.S. growth and housing prints steer the broad dollar, with crude oil acting as the usual, if secondary, cross-current for the loonie.
Two features are worth keeping at the front of the trading pad:
-
The market is trading with a broadly constructive view on U.S. real activity into year-end, but the path is uneven across sectors. Core capital goods orders (non-defense ex-aircraft) have been holding up better than the headline durable series; today’s breakdown between headline and core will matter for rate-cut pricing beyond the next Fed meeting. A headline miss set against a steady core sub-index tends to flatten the dollar’s intraday response relative to risk assets; a synchronized softness usually leaks into USD as front-end yields edge down.
-
Housing has pivoted from a drag to a neutral-to-mild support for U.S. growth in recent months as mortgage rates eased from their peaks. New home sales are volatile month-to-month, but high-frequency inventory and mortgage application data have improved enough that a downside shock isn’t the base case. For USD/CAD, that subtle improvement can translate into modest USD selling if it reduces safe-haven demand and supports oil-sensitive cyclicals.
The Canadian side of the ledger remains dominated by external factors. With no marquee domestic releases today, positioning will revolve around U.S. prints, risk tone, and oil. Oil’s intraday gyrations continue to map into CAD beta, but with a lower pass-through than earlier in the quarter; the liquidity and positioning data show USD/CAD flow is being driven more by U.S. dollar legs on data and policy headlines than by idiosyncratic CAD news. That mix argues for respecting the technicals on the chart while keeping an ear out for U.S. releases at 15:30 and 17:00 (GMT+3) and Treasury auctions into the close.
Technical analysis
Current technical conditions and main scenario
On the one-hour chart, USD/CAD is trading around 1.3977 after a weak European morning. The pair is tracking beneath the declining 50-period weighted moving average (WMA ~1.4001), with a sequence of lower highs and lower lows since last week’s spike toward 1.4040/1.4050. Price action has pressed into a Fibonacci cluster derived from the most recent intraday downswing:
-
61.8% retracement sits near 1.3984 (now overhead resistance).
-
100% swing projection aligns around 1.3979 (pivot that flipped to resistance after the early dip).
-
127.2% and 161.8% extensions sit at 1.3975 and 1.3970 respectively, followed by 200% near 1.3965.
This clustering reinforces the idea that 1.3984/1.3979 is the first-line cap, while 1.3975/70/65 is a stepping-stone ladder for continuation.
Bollinger Bands show the mid-line bending lower with price hugging the lower half of the envelope. Bandwidth has contracted compared with last Friday and Monday, which typically sets the stage for a volatility release as catalysts land. Importantly, each attempt to reclaim the mid-line has been faded quickly, and the most recent micro-bounce stalled exactly at the 100% retracement (1.3979), respecting the prior breakdown.
The base case is for a measured grind lower toward 1.3975 → 1.3970 → 1.3965 as the U.S. session opens, provided the pair remains capped beneath 1.3984/1.3990. Continuation under 1.3965 would expose last week’s congestion shelf near 1.3955/60, followed by 1.3945/50 where buyers defended repeatedly on the 15-minute chart.
Put differently: bears control the tape while price stays below the 50-WMA and the 1.3984/1.3990 shelf. Momentum structure supports incremental downside rather than a waterfall—unless an unexpected negative U.S. headline accelerates dollar selling.
Oscillators and breadth
• MACD (hourly) has rolled under its signal line and is leaning through the zero axis. The histogram moved negative and is expanding gently—consistent with a fresh bear phase, but not yet a momentum blow-off. When MACD turns sub-zero and price is pinned under the WMA and Bollinger mid-line, the probability of trend continuation rises, especially when key pivots cap rebounds (here, 1.3979/1.3984).
• Money Flow Index sits around 24 on the latest print. That’s distribution territory rather than fully oversold capitulation. This matters: a reading in the mid-20s combined with falling price indicates supply is still being absorbed on rallies; there’s room for MFI to tag the high-teens/low-20s if U.S. data nudges USD lower, which aligns with the 1.3965 objective.
• Average True Range on the hour has compressed to about 0.06. Low ATR into macro prints is a classic setup for range extension. The tactical takeaway is to avoid selling the absolute lows within minutes of data; instead, look to fade any post-release pop into the 1.3984/90/1.4000 resistance band if the underlying oscillator picture doesn’t repair.
• Volume profile: the latest push down occurred on modestly rising tick volume relative to the prior two hours, but still below last week’s distribution spikes. That tells us the move is technically driven rather than flow-panicked—again pointing to a steady, staircase-style drift lower unless a macro catalyst hits.
Key levels
Resistance
-
1.3984 – 61.8% retracement of the intraday downswing; the first gate.
-
1.3979/1.3990 – 100% swing pivot that flipped to resistance; a print and close back above 1.3990 on the hour would be the earliest sign the micro-trend is stalling.
-
1.4001/1.4008 – 50-WMA cluster and prior broken support; the heart of the sell-zone where rallies should struggle if bears are in shape.
-
1.4020/1.4040 – supply shelf from last week’s squeeze; only above here does the short-term structure turn neutral.
Support
-
1.3975 – 127.2% extension; first downside magnet.
-
1.3970 – 161.8% extension; a decisive hourly close below confirms trend persistence.
-
1.3965 – 200% extension; bears likely take partials here on the first touch.
-
1.3955/60 – late-week base; a break would aim 1.3945/50, then 1.3920/30 (deeper support from mid-month).
These levels are tightly aligned with current volatility, which is why risk placement matters. For intraday shorts initiated on a rejection of 1.3984/90, a protective stop above 1.3995/1.4005 keeps the trade honest while targeting the 1.3970/65 ladder.
Alternative scenario (less probable)
If USD/CAD can reclaim 1.3990 and sustain above 1.4000/1.4008 (hourly close), the bearish micro-trend is at risk. In that case, the path of maximum pain runs toward 1.4020 and the prior squeeze highs near 1.4040. This upside scenario likely requires a hawkish U.S. data surprise (stronger-than-anticipated core capital goods and a firm housing beat) that pushes front-end U.S. yields up and lifts the dollar broadly. The technical confirmation would be:
-
MACD crossing back above its signal with a rising histogram.
-
MFI rotating back above the 50 line (neutral zone) and staying there.
-
Price acceptance (two or more hourly closes) above the 50-WMA.
Until those conditions print, the risk-reward still favors fading upticks into resistance.
Fundamental outlook and trading implications
United States: Durables, housing, growth tracking and supply
The U.S. docket provides the day’s signal:
Durable goods orders (Sep): headline expected to contract on aircraft volatility, with core (ex-defense, ex-aircraft) still positive month-on-month. For USD, the composition is crucial. A soft headline with an okay core tends to generate only a modest front-end yield reaction; USD can fade a touch, but the move is rarely dramatic. A broad-based miss, by contrast, lowers the growth impulse and typically weighs on USD—supportive for a drift down in USD/CAD toward 1.3965/55.
New home sales (Sep): consensus 710K after 800K last month. Housing affordability has improved at the margin thanks to lower mortgage rates and stabilizing prices. A result close to consensus should not boost USD materially. A sizable downside surprise would pressure the dollar via rates; an upside beat could give USD a short-lived bid but would need to coincide with a solid core durables print to sustain a rally.
Treasury auctions (2-yr and 5-yr today): these matter through the term premium channel. Smooth auctions with reasonable tails may tamp down yields; weak demand and larger tails would push yields up. USD/CAD tends to track the 2s and 5s on such days, so keep an eye on bid-to-cover and indirect demand.
GDPNow checkpoint (3.9%): the nowcast anchors the market’s growth narrative. If durables materially undershoot, the street may anticipate a mild downward tweak at the next update, which usually trims USD strength at the margin. If the data hold up, the nowcast remains steady, and the dollar’s dips get shallower.
The policy overlay is straightforward: markets are still priced for additional Fed easing into year-end, but the path is data-dependent. The nearer those expectations drift toward a “one and done” profile, the stickier USD becomes on dips. Today’s reports feed that pricing.
Canada: Quiet slate, Oil pass-through and Bank of Canada context
Canada’s session is light. In that vacuum, two forces usually set the tone:
- Oil. CAD’s correlation with oil has weakened from earlier quarter highs but remains statistically meaningful on intraday horizons. If crude clips higher during the New York morning (for example, after inventory chatter or supply headlines), USD/CAD typically bleeds lower by a few pips per $1 move in WTI. A flat oil tape leaves USD/CAD to trade purely off the U.S. impulse.
- BoC expectations. With the Bank of Canada already signaling a data-dependent stance into year-end, front-end Canada is following the U.S. The cross-market implication is that USD/CAD often responds more to USD factors than to domestic surprises unless we get an outsized Canadian print or a BoC communication event—neither is on today’s calendar.
Given that backdrop, the day’s bias is tactical: lean short USD/CAD while the technicals trend lower, then reassess after the U.S. releases and the first hour of New York cash trading.
Scenario matrix and strategy
Base case: Soft-ish US headline durables, mixed internals; housing close to consensus
-
Rates reaction: modestly lower front-end yields, curve a touch steeper.
-
USD broad: gently offered.
-
Oil: neutral to slightly bid intraday.
-
USD/CAD path: extends lower into 1.3970/65 with shallow corrective bounces capped at 1.3984/90.
-
Tactics: Sell rallies into 1.3984/90 with a stop above 1.4000/1.4005; take partials at 1.3970/65; trail rest for a stab at 1.3955/50 if momentum builds. For those already short from higher levels, use the same zone to tighten risk.
Upside risk: firm core capital goods and strong new home sales, auctions sloppy
-
Rates: front-end pops, USD firmer.
-
USD/CAD path: squeezes through 1.3990 into 1.4000/08; if acceptance above WMA holds, path opens to 1.4020/40.
-
Tactics: Respect the stop discipline. If 1.4005 prints and holds on an hourly close, step aside. Aggressive traders can flip long on a retest hold of 1.4000 with tight risk (below 1.3985) for a 1.4020 first target.
Downside risk tail: Broad US miss and weak Oil
-
Rates: yields down decisively; USD sold.
-
Oil: if oil slips at the same time, CAD’s advantage is dulled—USD/CAD may slide less than USD/majors.
-
USD/CAD path: still likely to push 1.3955/50; further extension would require a material drop in U.S. yields and neutral-to-firm oil.
-
Tactics: Trail stops aggressively under 1.3965 to protect gains; watch 1.3955/50 for profit-taking. If oil also tanks, be willing to bank more at 1.3965/55 as CAD’s beta fades.
Risk management and microstructure cues
When trading around event risk, the microstructure matters as much as the macro. Three tells are especially useful on this chart:
- The first two post-release candles: If the first minute breaks below 1.3970 but the next three minutes see immediate absorption and a snap back above 1.3979, that’s your warning to avoid chasing. In contrast, if the first five-minute candle closes below 1.3970 with rising volume and the next candle fails to re-enter above 1.3975, continuation probabilities rise markedly.
- VWAP behavior: During New York morning, track where VWAP sits relative to the 50-WMA. If VWAP remains below the WMA by more than 6–8 pips for 30–45 minutes, rallies have tended to fail; fading into 1.3984/90 is higher quality in that case.
- Options strikes: The 1.4000 strike retains gravitational pull. Expect noise as spot oscillates around it. That is why our invalidation is placed through 1.4000/05, not right at the figure.
Putting it all together
USD/CAD’s intraday structure is clean: a controlled trend lower, fading bounces into a well-defined Fibonacci/WMA resistance belt and stepping down through shallow extension targets. Oscillators confirm—MACD is negative and widening, MFI shows distribution rather than capitulation, and volatility is coiling ahead of a catalyst.
With Canada quiet and the U.S. calendar heavy, the data will likely decide whether we get the measured grind to 1.3965 and perhaps 1.3955, or a stop-run over 1.3990 that forces respect for 1.4000/08 and puts 1.4020/40 back into view. The base case favors the former: fading rallies under 1.3984/90 with tight risk above the figure offers positive expected value given the current momentum regime.
Trade blueprint (intraday)
-
Bias: Sell rallies while below 1.3990/1.4000.
-
Entry zone: 1.3984–1.3990 on rejection patterns (wick rejections, bearish engulfing on 5–15m, failure to hold VWAP).
-
Stop: 1.4005 (conservative 1.4010).
-
Targets: 1.3975 → 1.3970 → 1.3965; optional runner 1.3955/50.
-
Alternative long: Only on an hourly close above 1.4005 with MACD flip; target 1.4020 then 1.4040; stop back below 1.3990.
What would change the view?
-
A sustained hourly close above the 50-WMA with momentum confirmation (MACD positive, MFI above 50 and rising) would neutralize the short setup.
-
A surprise Canadian catalyst (for example, an unscheduled BoC headline or a sharp crude oil dislocation) that decouples CAD from the U.S. impulse warrants re-assessment of levels and stops in real time.
Final thoughts
USD/CAD is a technician’s market today, with macro catalysts providing the nudge rather than the narrative overhaul. Respect the 1.3984/1.3990/1.4000 resistance ladder: while the pair trades beneath it, bears have earned the benefit of the doubt and the path of least resistance is toward 1.3970/65 and perhaps the weekly base near 1.3955/50. Keep sizing modest into the data prints, let the first reaction play out, and then lean with the prevailing structure.
In short: sell the upticks unless 1.4005 is reclaimed and held; buy the dip only if the macro breaks decisively in the dollar’s favor and the chart confirms with acceptance back above the WMA and the figure.
Author

Ali Mortazavi
Errante
BEc, CMSA, Member of IFTA - International Federation of Technical Analysis, Associate Member of STA - Society of Technical Analysis (UK).


