|

USD/CAD has lots more room to the downside after the big break — Confluence Detector

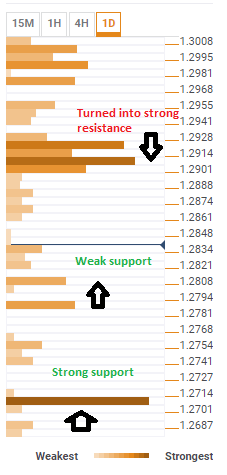
The Technical Confluences Indicator shows that the USD/CAD broke under a dense cluster of technical support levels around C$1.2915 on its way down. This level is the confluence of the SMA50-15m, the SMA-10-4h, the SMA5-1h, the SMA10-1h, the SMA200-15m, the Bolinger Band 1h Middle-Stdv, the SMA100-15m and more lines. This dense cluster now turns in strong resistance

The pair fell quickly as there was little resistance on the way. The 1.2808 level is the 1 week low but it may not be enough to hold the pair.

The pair still has a lot of room to the downside, with significant resistance awaits only at 1.2710, where the Fibo 23.6% 1 meets the Pivot Point 1w S2. 

All in all, the pair may extends its falls to much lower ground after the big drop to the downside. 

USDCAD confluence March 23 2018

Confluence Detector

The Confluence Detector finds exciting opportunities using Technical Confluences. The TC is a tool to locate and point out those price levels where there is a congestion of indicators, moving averages, Fibonacci levels, Pivot Points, etc. Knowing where these congestion points are located is very useful for the trader, and can be used as a basis for different strategies.

This tool assigns a certain amount of “weight” to each indicator, and this “weight” can influence adjacents price levels. This means that one price level without any indicator or moving average but under the influence of two “strongly weighted” levels accumulate more resistance than their neighbors. In these cases, the tool signals resistance in apparently empty areas.

Learn more about Technical Confluence

Author

Yohay Elam

Yohay Elam

FXStreet

Yohay is in Forex since 2008 when he founded Forex Crunch, a blog crafted in his free time that turned into a fully-fledged currency website later sold to Finixio.

More from Yohay Elam
Share:

Editor's Picks

AUD/USD advances modestly, hovers around 0.7050

AUD/USD reverses part of Friday’s sharp decline and gyrates around the 0.7050 region ahead of the opening bell in Asia. The pair’s modest recovery comes amid humble losses in the Greenback, always amid the steady uncertainty on the geopolitical front. Moving forward, Westpac’s Consumer Confidence measure will be the salient release on Tuesday.

USD/JPY holds higher ground toward 160.50 despite 'Yentervention' fears

USD/JPY holds higher ground toward 160.50 in Monday's Asian trading, despite intervention fears. Japan’s revised GDP print, which confirmed that the economy lost momentum in the first quarter, weighs on the Japanese Yen. Meanwhile, Friday's upbeat US NFP report and fresh Israel-Iran attacks favor the US Dollar bulls, underpinning the currency pair.

Gold faces initial resistance near  $4,350

Gold manages to reclaim the $4,300 mark per troy ounce and above on Monday. The yellow metal’s small uptick comes on the back of modest losses in the US Dollar, while traders continue to follow geopolitical events in the Middle East and the likelihood of a tighter-for-longer Fed.

Why institutions prefer Solana over newer rivals for stablecoin adoption – Solstice CEO
The cryptocurrency industry has entered a new era spearheaded by stablecoins, real-world asset (RWA) tokenization, decentralized finance (DeFi), and Artificial Intelligence (AI) applications.
$1.75 trillion: Is SpaceX the most popular IPO in history, or the most engineered?

On June 12, the largest initial public offering (IPO) in history is set to hit the tape, and almost nobody is asking whether the price is right, because almost everybody already wants in.

The US economy defies the rules: 100 days into the Oil shock and the recession signal is still missing

More than three months after the start of the Iran war and the resulting disruption to global energy markets, the US economy continues to display remarkable resilience. The conflict has triggered a sharp rise in Oil prices, reignited inflationary pressures and fueled widespread concerns about a potential economic slowdown.