USD/CAD Had Its Biggest Fall in a Month; Rebound on 1.2400 is Expected

The USD/CAD had the biggest fall in a month yesterday, due to the FOMC Minutes and the rise of the oil prices followed. The pair dropped 0.50% in a single day, creating two consecutive negative candles.
WTI jumped 2.70% on Tuesday and 0.33% on Wednesday, as the U.S. Energy Information Administration raised its price forecasts on both WTI and Brent Crude oil for this and the next years, and increased its U.S. production outlook for 2018 as the demand increased. More specifically, the monthly report of the OPEC revealed that the oil production increased by 90,000 barrels a day in September despite the efforts of the major producers to limit the output. The oil production of the non-OPEC countries, also increased by 31,000 barrels a day, boosted from a pick-up in U.S. production. The demand seems to be increased by 1.5 million barrels a day this year and 1.4 million barrels a day in 2018, thus they revised up the forecast for growth in global demand by approximately 30,000 barrels a day for the current and next year.
At the same time, while the traders expect Fed to raise rates in December, the FOMC minutes released, showed the concerns of some policymakers regarding the inflation rate. However, others argued that the delay of monetary tightening “could result in an overshoot of the Committee’s inflation objective in the medium term that would likely be costly to reverse or could lead to an intensification of financial stability risks or to other imbalances that might prove difficult to unwind”. Greenback reacted negatively to the dovish minutes despite that a part of them has been predictable.
USD/CAD – Technical Outlook
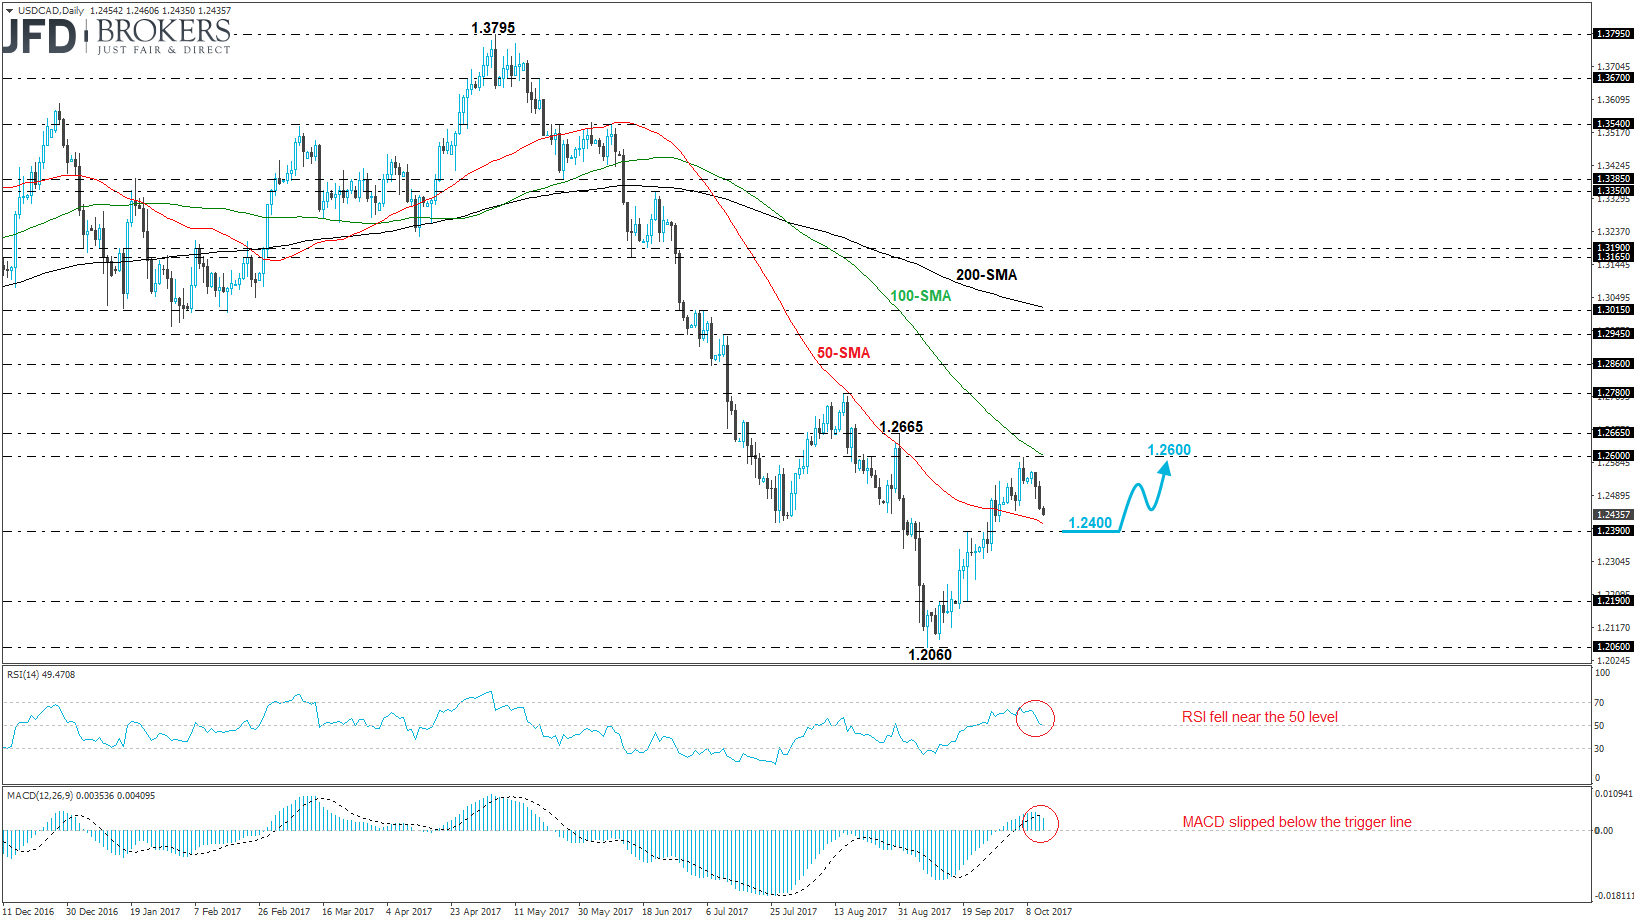
The U.S. dollar had an aggressive bearish movement against the Canadian dollar during the last two days and started the fall after the rebound on the 1.2600 strong psychological level, which coincides with the 100-day SMA. The USD/CAD pair is ready to the touch the 50-day SMA, slightly above the 1.2390 support handle.
Additionally, the commodity currency pair slipped beneath the 200-week SMA and is posting the third consecutive neutral month. The latter levels may act as strong resistance obstacles and hold the price above them. On the short-term chart, the RSI indicator slipped near the 50 level and the MACD oscillator posted a bearish crossover below the trigger line.
West Texas Intermediate – Technical Outlook
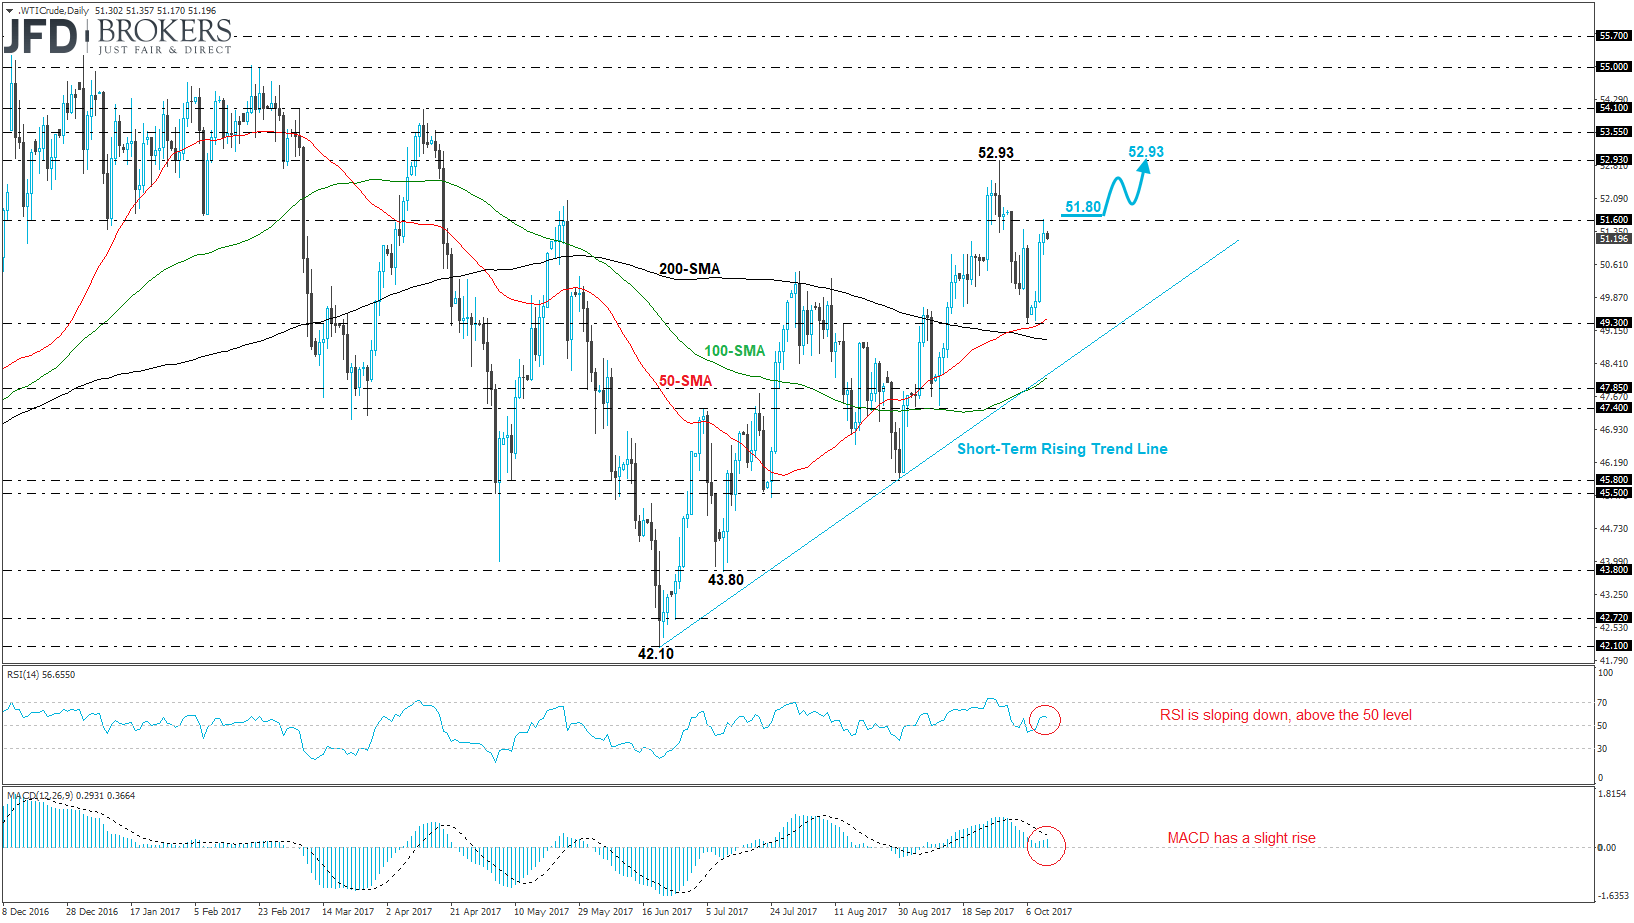
The West Texas Intermediate (WTI) crude oil exposed towards the $51.60 resistance level and surged more than 4.4% over the last four days. The bounce off the $49.30 support level, which overlaps with the 50-day SMA and 50-week SMA, helped the price to move towards the aforementioned resistance barrier. If the price climbs above $51.60, will open the way for the $52.93 handle.
The technical structure on the short-term chart seems to be in confusion. The Relative Strength Index (RSI) is pointing to the downside but is developing within the bullish path. Also, the MACD oscillator is ready to hit the trigger line to the upside and create a bullish crossover in the positive territory.
Author

JFD Team
JFD


