USD/CAD Forecast: With oil rising Lonnie is set to take over greenback
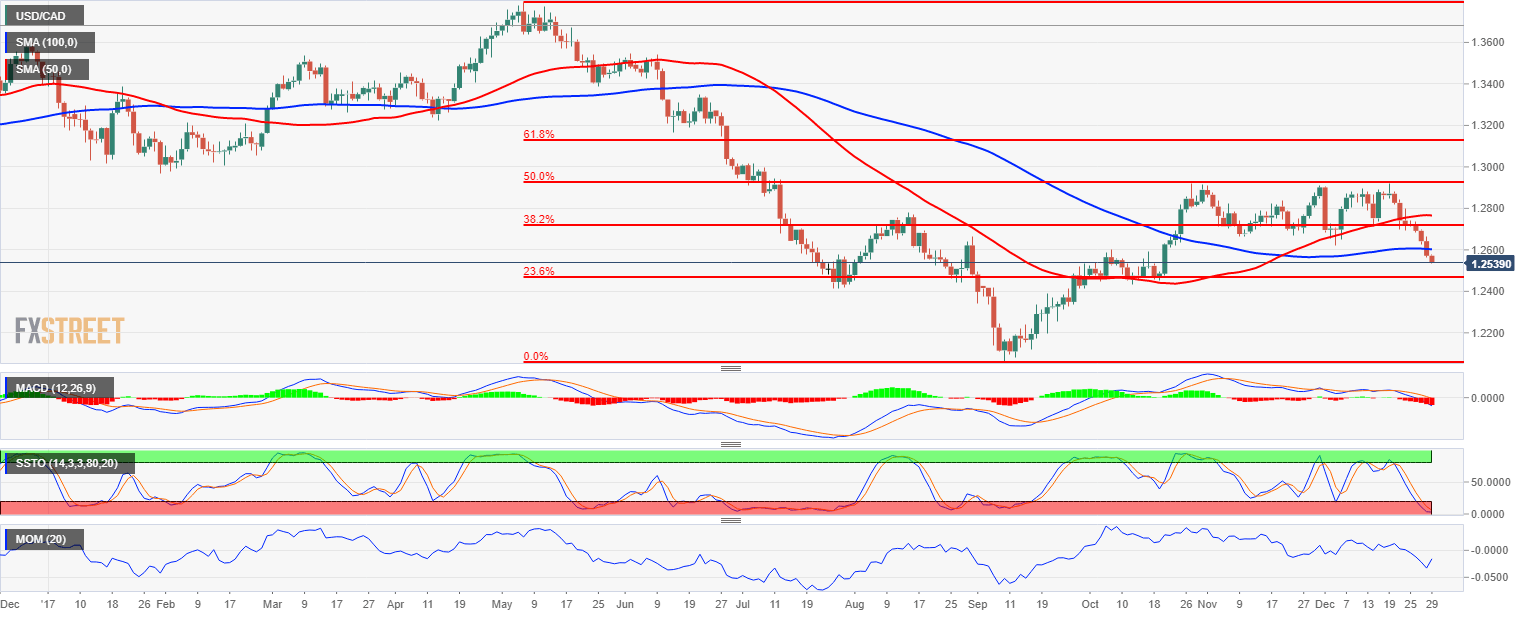
The USD/CAD has declined sharply after breaking major support at C$1.2600 and it is trading down 0.25% at C$1.2535 with a new target of C$1.2465.
The USD/CAD has declined sharply after breaking a Fibonacci at C$1.2720 with Canadian Dollar extending gains after breaking the round big figure of C$1.2600 supported by the rising oil prices.
The US crude oil benchmark rose to a two-and-a-half year high of $60.38 after the Energy Information Administration reported a decrease in oil inventories of above expectations.
The US commercial crude oil inventories decreased by 4.6 million barrels in a week ending December 22 to 431.9 million barrels. The US crude oil inventories are in the middle of the average range for this time of year.
The sideways trend on USD/CAD has been invalidated by the exchange rate breaking on the downside busting a technical support of C$1.2720 represented by 38.2% Fibonacci retracement of long-term appreciation of Loonie towards C$1.2097 from a low of C$1.2920.
The daily chart indicates that the USD/CAD is moving lower for the eighth day in a row, bringing the Slow Stochastics indicator to the Oversold territory. Technical oscillators like Slow Stochastics and MACD arel pointing downwards indicating further potential in current bearish trend lower with C$1.2465 representing 23.6% Fibonacci retracement of a large bearish trend from C$1.29230 to C$1.2097.
USD/CAD daily chart
Author

Mario Blascak, PhD
Independent Analyst
Dr. Mário Blaščák worked in professional finance and banking for 15 years before moving to journalism. While working for Austrian and German banks, he specialized in covering markets and macroeconomics.


