USD/CAD Forecast: After Trump’s Iran Move, Inflation is eyed

Dollar/CAD suffered from Trump’s move on the Iran deal and as oil priced sold the fact. What’s next? The double-feature inflation and retail sales reports stand out. Here are the highlights and an updated technical analysis for USD/CAD.
The US is abandoning the Iran nuclear deal and imposing sanctions on the country. This pushed oil prices higher and thus supported the Canadian dollar. The risk-off sentiment that accompanied the initial news faded away and allowed the loonie to extend its gains. The move somewhat reversed on Friday as Canada published disappointing jobs report that showed a loss of 1.1K jobs. The pair moved back up.
Updates:
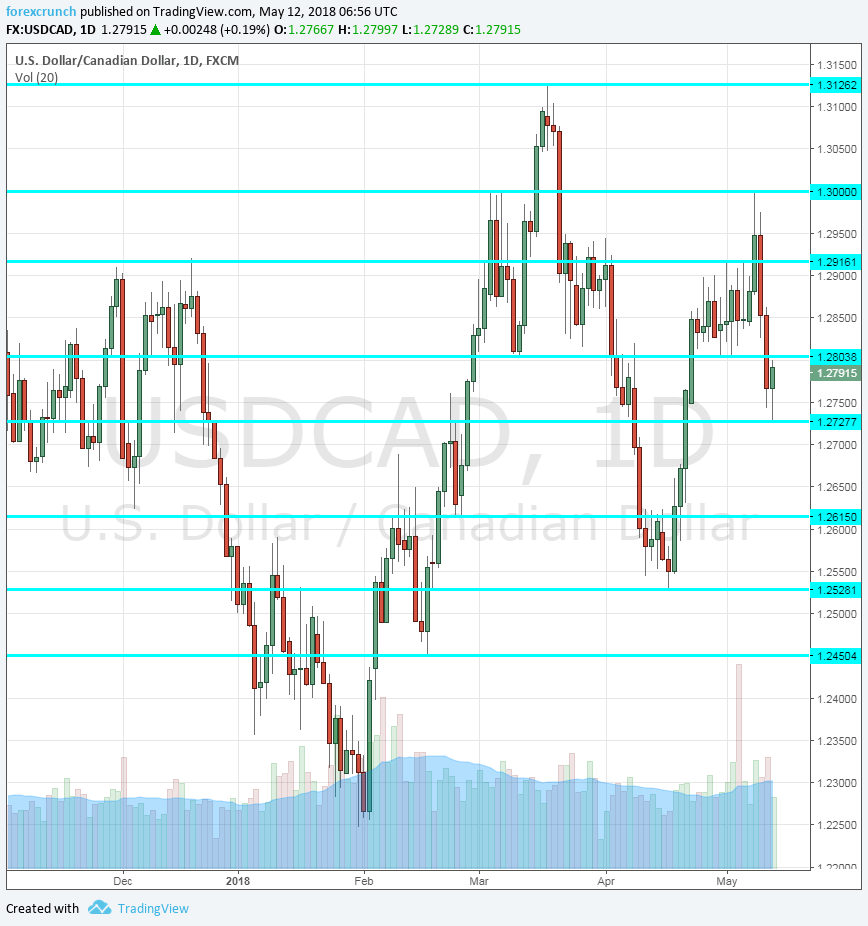
USD/CAD daily graph with support and resistance lines on it.
-
Manufacturing Sales: Monday, 12:30. Sales at the manufacturing level provide insights for the wider economy. The value of sales increased last time by 1.9% and may show a moderation now.
-
Foreign Securities Purchases: Thursday, 12:30. Flows of money into Canada serve as a measure of confidence and also impact the exchange rate. The surplus was only 3.96 billion in February, below expectations. It could widen now.
-
ADP Non-Farm Employment Change: Thursday, 14:30. The private sector report by Automated Data Processing comes after the official release but still provides interesting insights. The firm showed a gain of 42.3K in March.
-
BOC Review: Thursday, 14:30. The Bank of Canada publishes this report twice per year and it tends to have a weaker impact than the Business Survey. Nevertheless, the updates on the economy will be of interest.
-
Inflation report: Friday, 12:30. Inflation surprised to the downside in March, with headline CPI advancing by 0.3% and Core CPI by 0.2%. The other measures of price development were OK with Common CPI up by 1.9% y/y, the Median CPI at 2.1%, and Trimmed CPI at 2%. Similar figures are likely for April.
-
Retail Sales: Friday, 12:30. Competing with the inflation report, retail sales lag and are for the month of March this time. Back in February, Retail Sales rose by 0.4% m/m while core sales remained flat. Better data is on the cards now.
USD/CAD Technical Analysis
Dollar/CAD initially attempted to rise above 1.30 (discussed last week) but then turned south.
Technical lines from top to bottom:
1.3180 was a support line in 2017 and now turns into resistance. 1.3125 is the high point for 2018 so far.
1.30 is a round number that is eyed by many. 1.1915 capped the pair in late April and early May.
1.2810 provided support in late March. 1.2730 was the low point in mid-May.
1.2665 was a was a double-bottom in November and works as strong support. It is followed by 1.2615, which provided support in November.
Further below, we find 1.2545, the low point in mid-April. Another round of selling may send the pair towards 1.2450, a swing low in mid-February and 1.2290 is next.
I remain bearish on USD/CAD
Despite the disappointing labor market report, the Canadian economy is doing well and with some further USD retreat, the pair could extend its falls.
Author

Yohay Elam
FXStreet
Yohay is in Forex since 2008 when he founded Forex Crunch, a blog crafted in his free time that turned into a fully-fledged currency website later sold to Finixio.

















