|

USD/CAD Elliott Wave view: Entering into a wave five lower [Video]

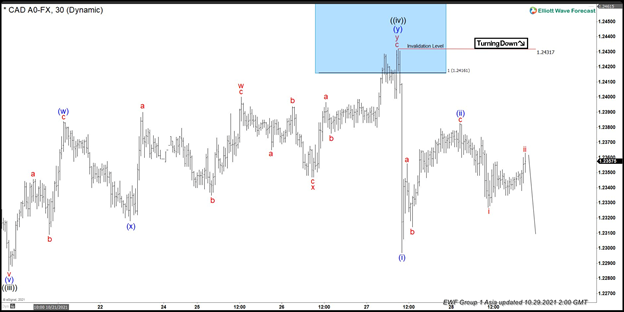
Short-term Elliott wave view in USDCAD suggests that the decline from September 20, 2021, high is unfolding as an impulse structure favoring some more downside. Down from 9/20/2021 high, wave ((i)) ended in 5 waves at $1.2590 low. Wave ((ii)) ended at $1.2774 high, and wave ((iii)) ended in 5 waves at 1.2309 low. Then above from there, the pair made a bounce in wave ((iv)) in a shorter cycle. The internals of that bounce unfolded as a double three structure.

Whereas the initial 3 waves bounce to $1.2383 ended wave (w). Then a pullback to $1.2318 low ended wave (x). Up from there, the pair started the (y) leg higher & reached the 100%-161.8% Fibonacci extension area of (w)-(x) at $1.2416- $1.2476 blue box area. The pair got rejected within the blue box area & ended (y) leg at $1.2431 high thus completing the wave ((iv)) bounce. Below from there, we believe wave ((v)) has started lower where lesser degree wave (i) ended at $1.2297 low. And wave (ii) ended at $1.2382 high. Near-term, as far as bounces fail below $1.2382 high and more importantly below $1.2431 high the pair is expected to see more downside towards $1.2248- $$1.2191 inverse 123.6%- 161.8% Fib ext area of ((iv)) minimum. Before the pair completes its 5 waves impulse sequence from 9/20/2021 high & does a bounce.

USD/CAD 1 Hour Elliott Wave chart
USDCAD

USD/CAD Elliott Wave video

Author

Elliott Wave Forecast Team

Elliott Wave Forecast Team

ElliottWave-Forecast.com

More from Elliott Wave Forecast Team
Share:

Editor's Picks

GBP/USD extends the drop to 1.3360

GBP/USD builds on Monday’s decline and briefly clinches five-day lows near 1.3360 on Tuesday. Cable’s extra pullback follows the better tone in the Greenback as uncertainty in the Middle East prompts investors to adopt a cautious stance. Meanwhile, an apathetic UK labour market report also collaborates with the selling pressure on the British Pound.

EUR/USD stays offered just above 1.1400

EUR/USD keeps the downtrend well in place for yet another day, challenging the 1.1400 contention zone on Tuesday. The continuation of the selling impulse in spot comes amid decent gains in the US Dollar, which continues to find support in the persistent effervescence surrounding the US-Iran crisis.

Middle East crisis intensifies, Gold up

Gold now seems to have embarked on a consolidative phase below the key $4,100 mark per troy ounce in the latter part of Tuesday’s session. Meanwhile, uncertainty surrounding the Middle East conflict and rising expectations for a hawkish Fed policy outlook are expected to limit the precious metal’s bullish momentum in the near term.

XRP rebounds on rising on-chain activity
Ripple (XRP) ticks up and trades around $1.13 at the time of writing on Tuesday. This rebound aligns with a broader recovery in the cryptocurrency market, attributed to reports that mediators between the United States (US) and Iran are seeking a 10-day cessation of strikes to find a way back to the signed Memorandum of Understanding (MoU).
The Iranian war has again risen
The Iranian war has again risen to the top of the economics factor list. There is no end in sight. Intelligence experts say the current level of offense/retaliation will not change minds in Tehran, while in Washington, Trump fears all-out war, which would mean boots on the ground.
US Dollar mid-year outlook: Exceptional currency, exceptional risks?
The US Dollar enters the second half of 2026 in a markedly different position from a year ago. The King currency has recovered, reflecting persistent US inflation, changing expectations for Fed policy, geopolitical tensions and renewed demand for defensive assets.
















