|

USD/CAD Elliott Wave forecasting the path and buying the dips

In this article we’re going to take a quick look at the Elliott Wave charts of USDCAD, published in members area of the website. We have been favoring the long side in the pair.  As our members know, the pair  that has given us good buying opportunities recently.  We recommended members to avoid selling the pair, while keep favoring the long side. In the further text we are going to explain the Elliott Wave Forecast and trading strategy.

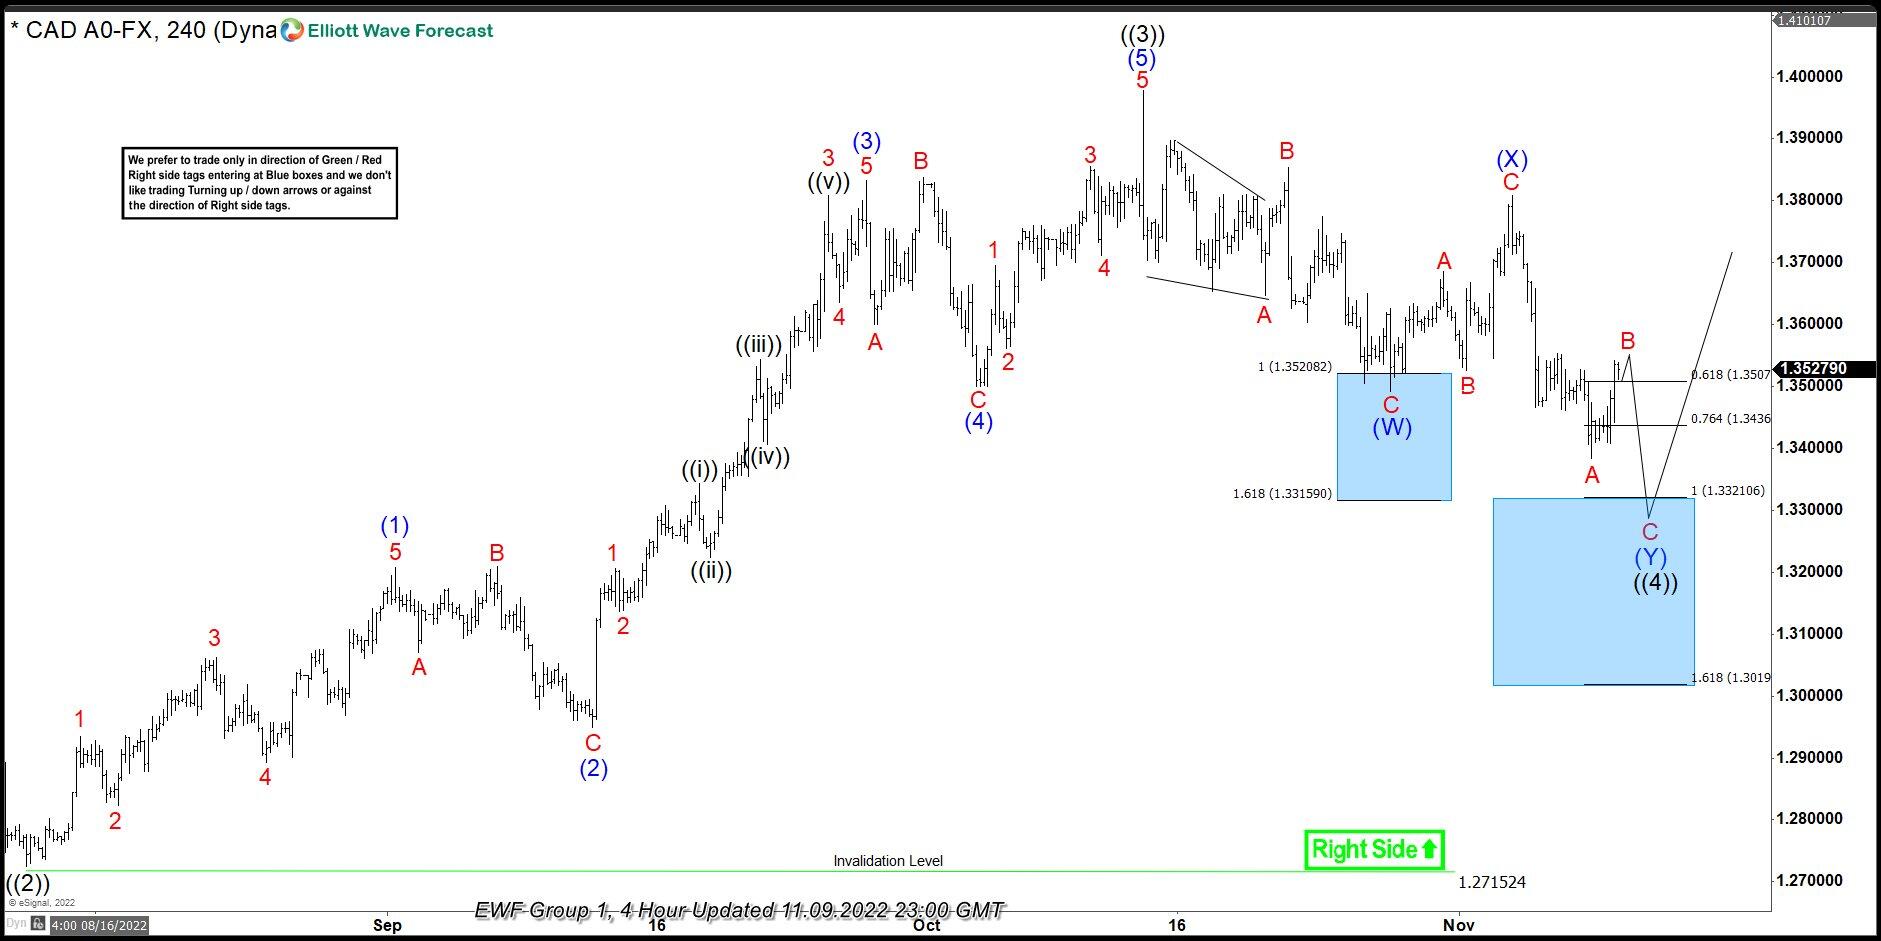
USD/CAD Elliott Wave 4 hour chart 11.09.2022

The pair made bounce from first set of equal legs. We got 3 waves bounce that allowed us to make long positions risk free + take partial profits.  That trading setup has been explained in previous  technical article. After reaction that unfolded in 3 waves, USDCAD made sharp decline and made new short term low. Now , the pair is showing lower low sequences from the peak suggesting  wave ((4)) is still in progress.  Correction looks incomplete and we expect to see more downside toward 1.3321-1.3019 which would be next buying zone. We don’t recommend selling the pair against the main bullish trend. Strategy is waiting for the price to reach next set of equal legs, before entering the long trades again.  Invalidation for the long trades is break of 1.618 fib ext : 1.3019.

Quick reminder:

Our charts are easy to trade and understand:
Red bearish stamp+ blue box = Selling Setup
Green bullish stamp+ blue box = Buying Setup
Charts with Black stamps are not tradable.  

USDCAD

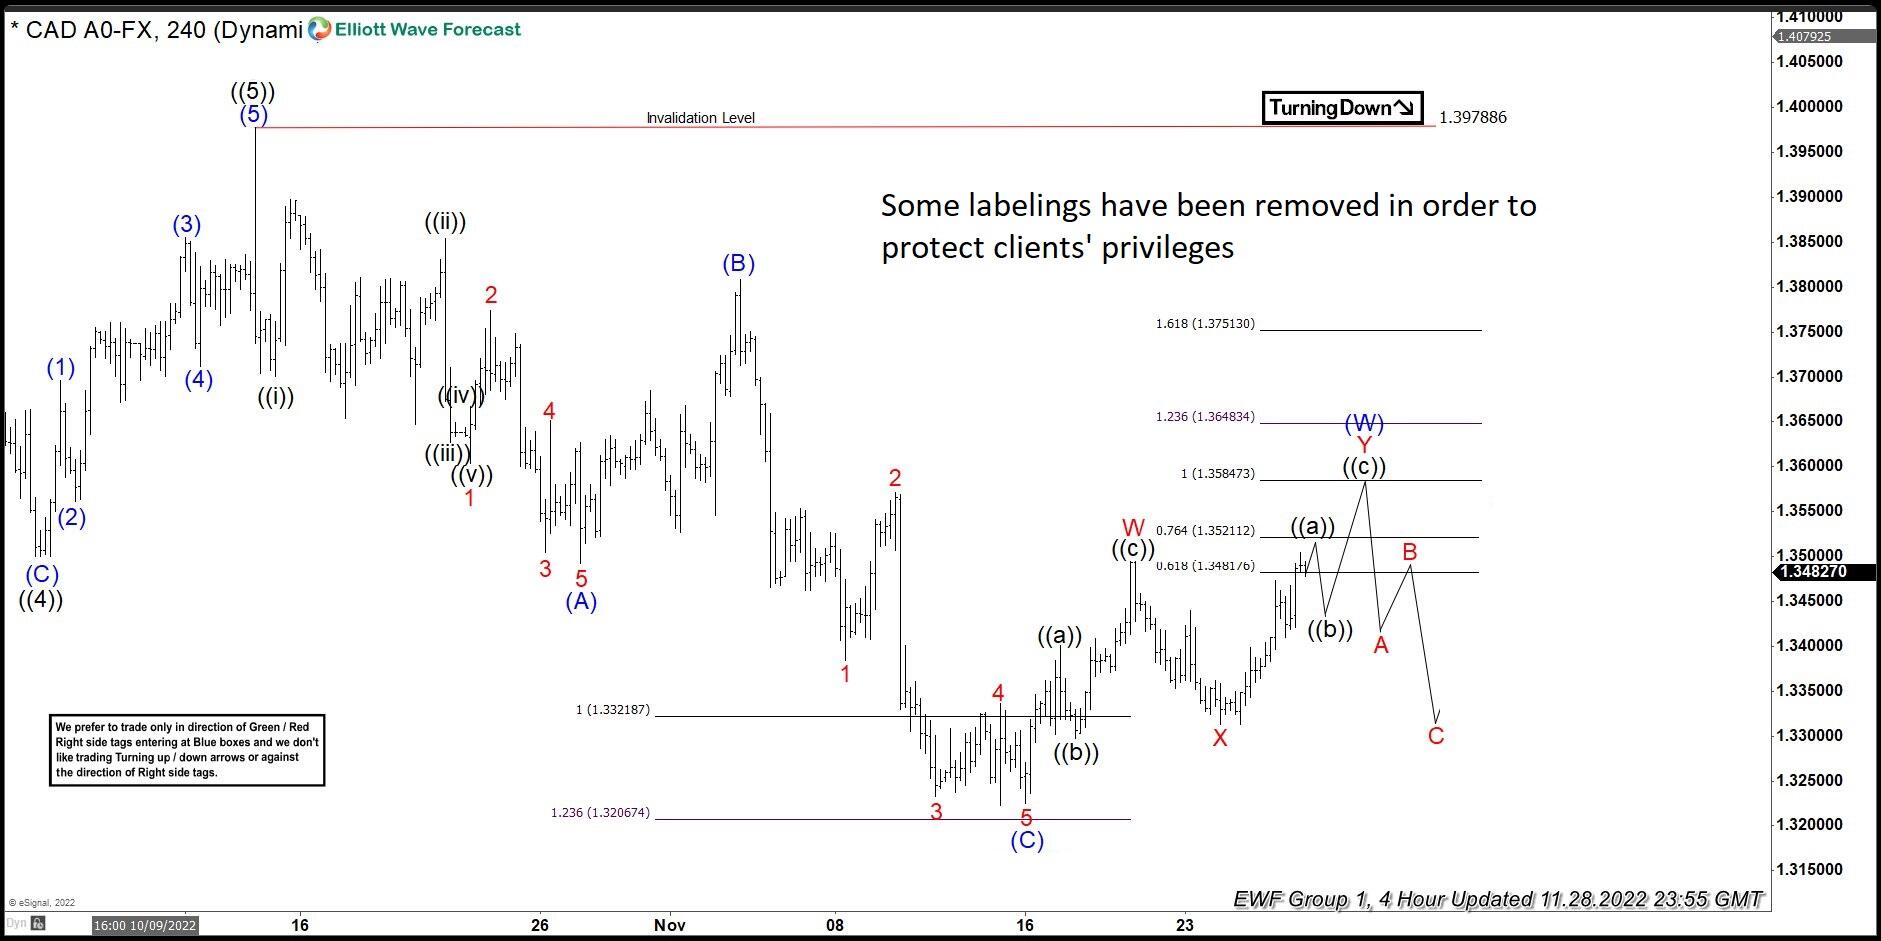
USD/CAD Elliott Wave 4 hour chart 11.28.2022

USDCAD reached buying zone at 1.3321-1.3019 area as expected. The pair found buyers at the  Blue Box – buying zone and we are getting good reaction from there. Currently the price shows higher high sequences from the lows, suggesting next short term tech zone comes at 1.35847-1.3751. At that zone we can complete 3 waves up from the lows and see 3 wave pull back at least.

Chart

Author

Elliott Wave Forecast Team

Elliott Wave Forecast Team

ElliottWave-Forecast.com

More from Elliott Wave Forecast Team
Share:

Editor's Picks

EUR/USD hovers around nine-day EMA above 1.1800

EUR/USD remains in the positive territory after registering modest gains in the previous session, trading around 1.1820 during the Asian hours on Monday. The 14-day Relative Strength Index momentum indicator at 54 is edging higher, signaling improving momentum. RSI near mid-50s keeps momentum balanced. A sustained push above 60 would firm bullish control.

GBP/USD holds medium-term bullish bias above 1.3600

The GBP/USD pair trades on a softer note around 1.3605 during the early European session on Monday. Growing expectation of the Bank of England’s interest-rate cut weighs on the Pound Sterling against the Greenback. 

Gold sticks to gains above $5,000 as China's buying and Fed rate-cut bets drive demand

Gold surges past the $5,000 psychological mark during the Asian session on Monday in reaction to the weekend data, showing that the People's Bank of China extended its buying spree for a 15th month in January. Moreover, dovish US Federal Reserve expectations and concerns about the central bank's independence drag the US Dollar lower for the second straight day, providing an additional boost to the non-yielding yellow metal. 

Bitcoin, Ethereum and Ripple consolidate after massive sell-off

Bitcoin, Ethereum, and Ripple prices consolidated on Monday after correcting by nearly 9%, 8%, and 10% in the previous week, respectively. BTC is hovering around $70,000, while ETH and XRP are facing rejection at key levels.

Weekly column: Saturn-Neptune and the end of the Dollar’s 15-year bull cycle

Tariffs are not only inflationary for a nation but also risk undermining the trust and credibility that go hand in hand with the responsibility of being the leading nation in the free world and controlling the world’s reserve currency.

Bitcoin, Ethereum and Ripple consolidate after massive sell-off

Bitcoin, Ethereum, and Ripple prices consolidated on Monday after correcting by nearly 9%, 8%, and 10% in the previous week, respectively. BTC is hovering around $70,000, while ETH and XRP are facing rejection at key levels. Traders should be cautious: despite recent stabilization, upside recovery for these top three cryptocurrencies is capped as the broader trend remains bearish.