USD/CAD can be trapped in a triangle – More weakness after completed A-B-C-D-E waves [Video]
![USD/CAD can be trapped in a triangle – More weakness after completed A-B-C-D-E waves [Video]](https://editorial.fxstreet.com/images/Markets/Currencies/Majors/USDCAD/canadian-dollars-57161236.jpg)
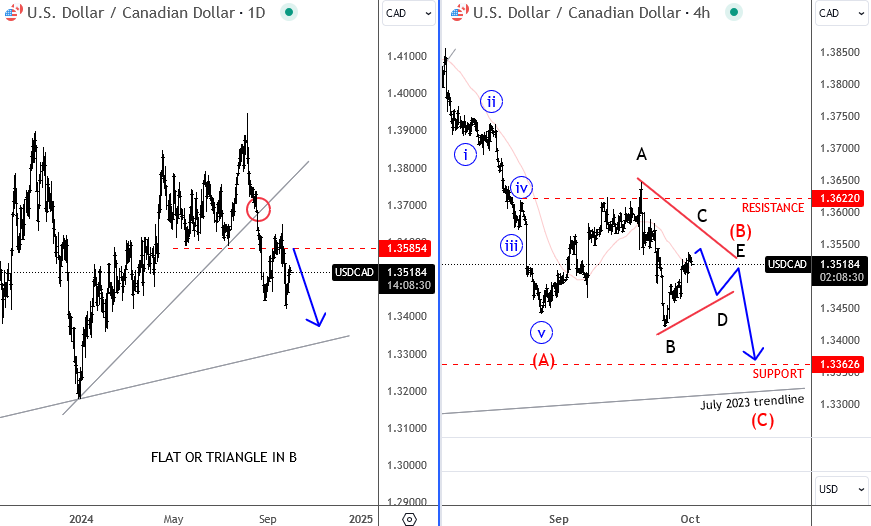
USDCAD is reversing south after an unsuccessful push above 2022 highs, so it appears that pair is back in the range after making the first impulsive drop to 1.3450 back in August. Notice that after that drop in A, price rallied in wave (B) as expected, and stoped perfectly at 1.36 area as discussed in past updates. But notice that pair is actually now sideways, and back in 200 pip range, rather than bearish, so it appears that this can be a triangle with more weakness in view, but after A-B-C-D-E legs are completed. We still think that sooner or later USDCAD can drop to July 2023 trendline.
More FX analysis in video below
Get Full Access To Our Premium Elliott Wave Analysis For 14 Days. Click here.
Get Full Access To Our Premium Elliott Wave Analysis For 14 Days. Click here.
Author

Gregor Horvat
Wavetraders
Experience Grega is based in Slovenia and has been in the Forex market since 2003.


