USD bounces off of S2 support

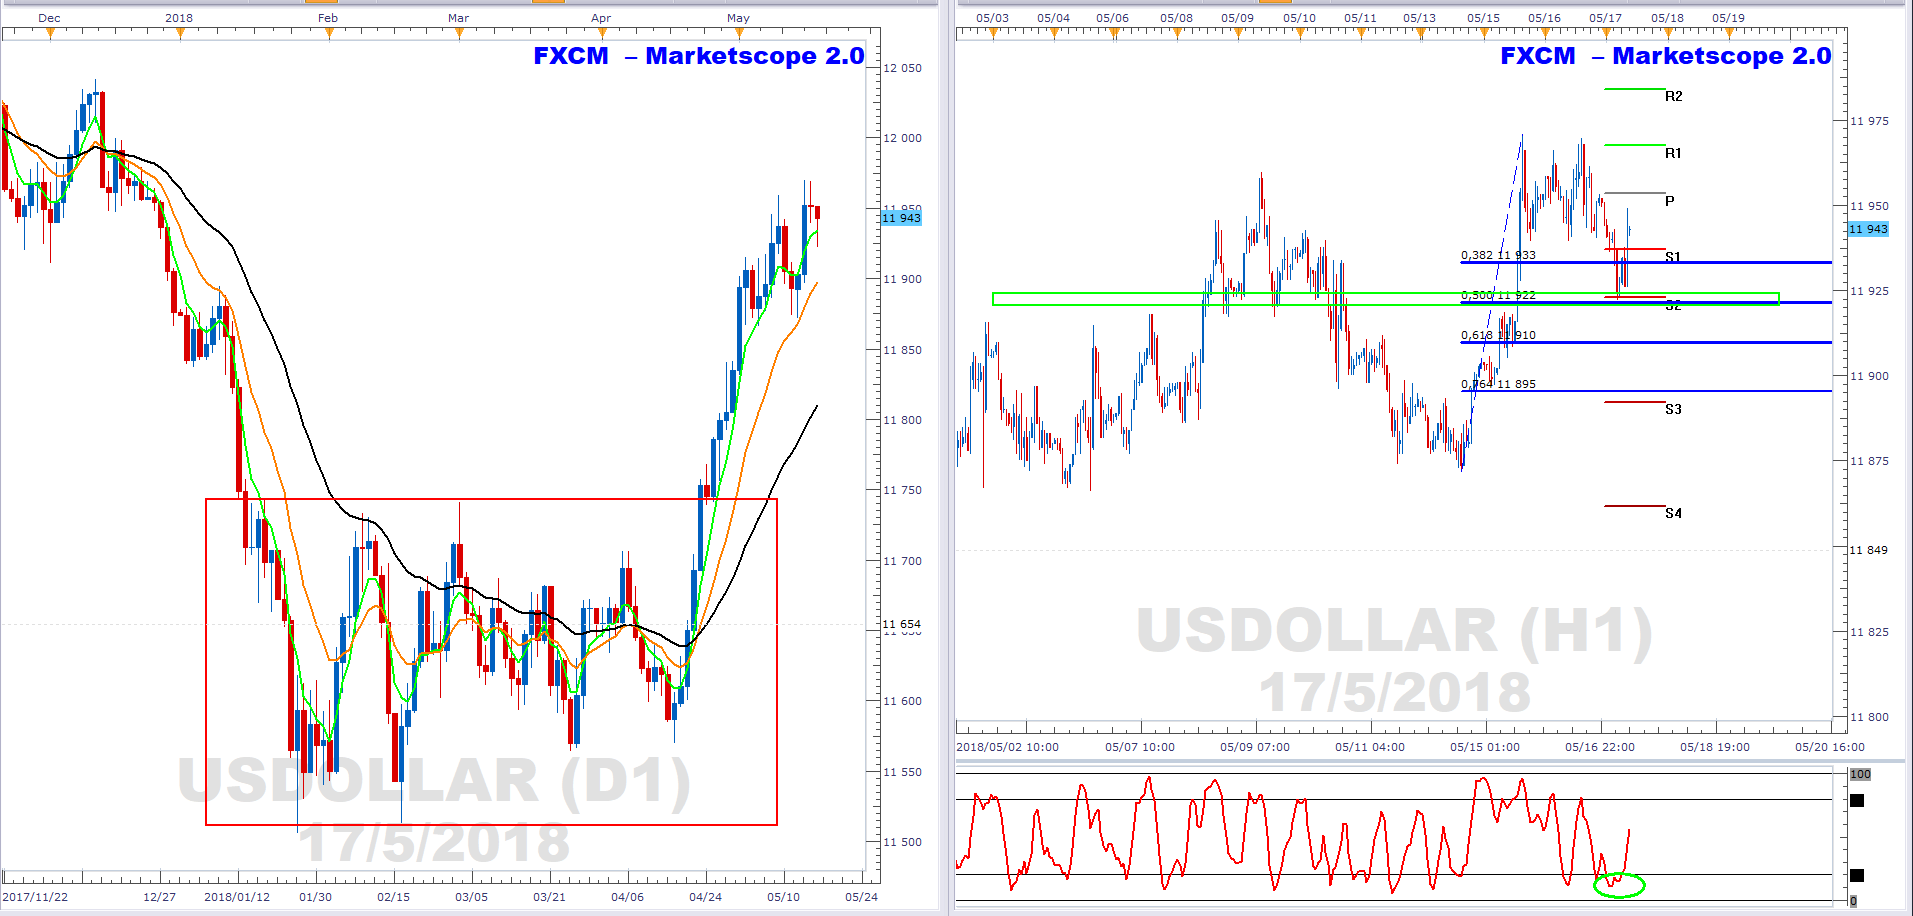
The left chart shows USD daily price action. As can be seen it is in mark-up phase. This is characterised by a bullish EMA formation. I.e. the green 5-day EMA is above the orange 13-day EMA, and the orange 13-day EMA is above the black 34-day EMA.
The right chart shows hourly price action. Price found support at a key level with a confluence of factors including, S2 pivot support; 50% Fibonacci retracement support, price support (green rectangle); and an oversold stochastic (green ellipse).
The US 10-Yr treasury continues higher at 3.11% currently. This has increased demand for the USD which bounced at the pullback off of support.
Author

Russell Shor (MSTA, CFTe, MFTA) has an Honours Degree in Economics from the University of South Africa and holds the coveted Certified Financial Technician and Master of Financial Technical Analysis qualifications from the Interna


