USD bounces in short-term but is still fragile in the long-term
Past performance is not an indicator of future results
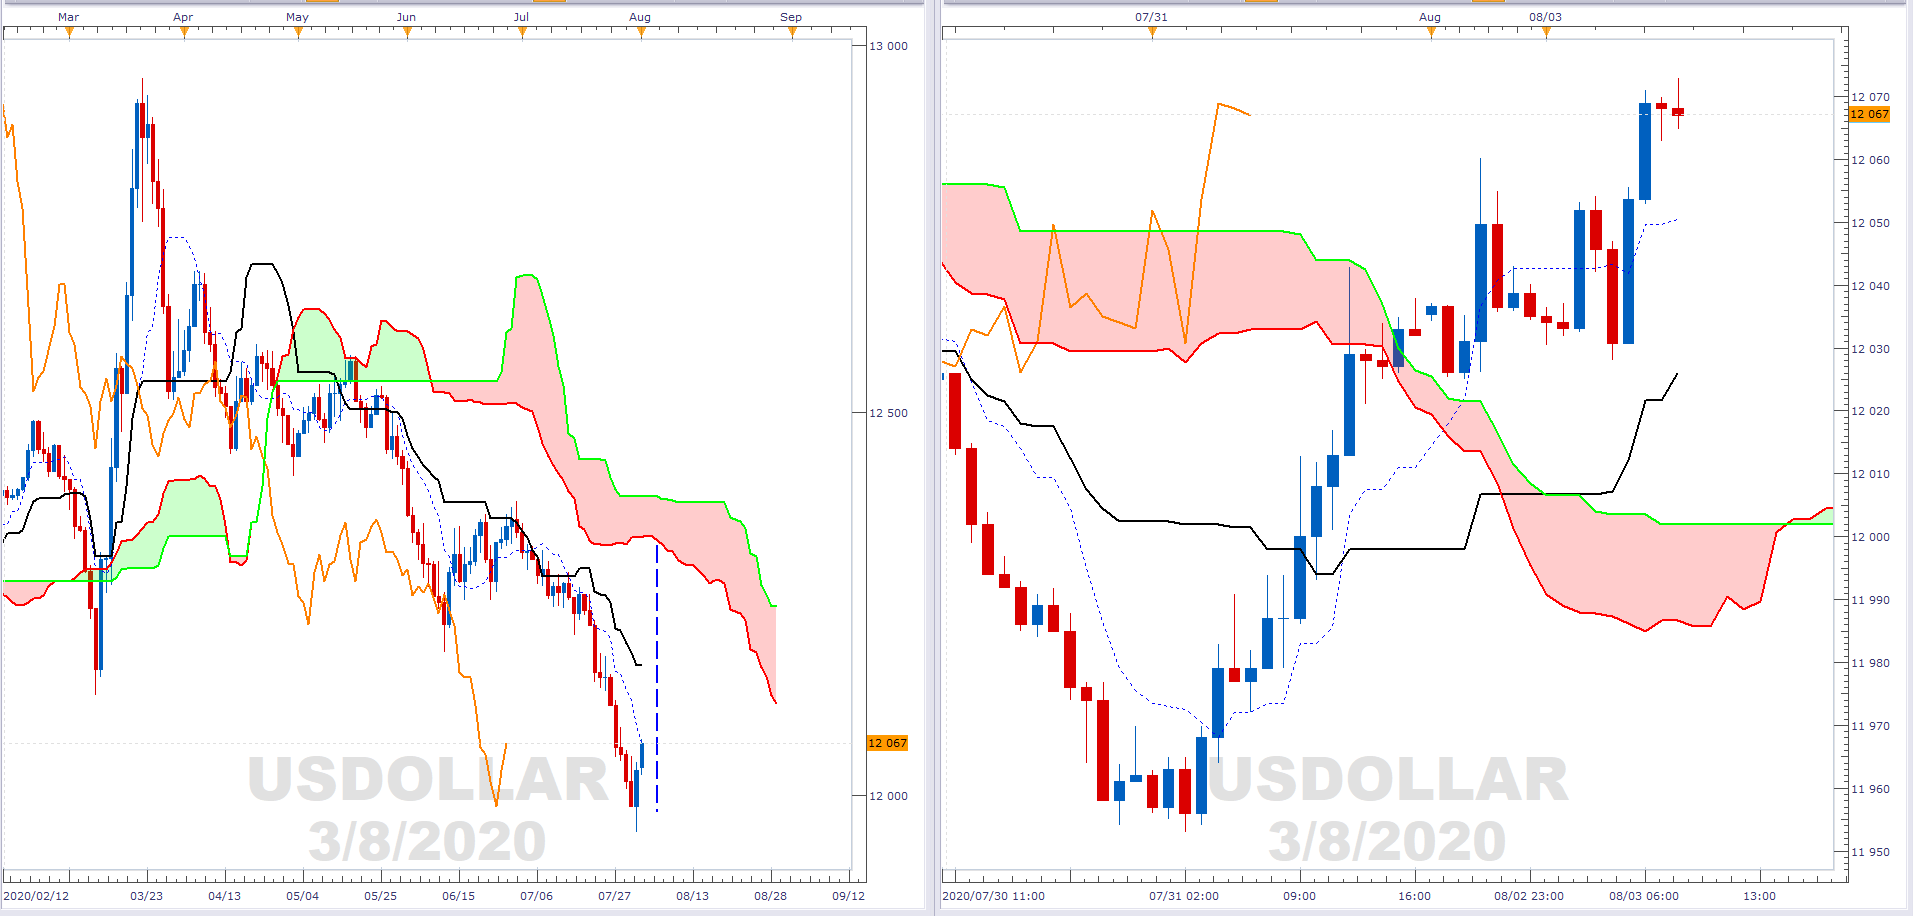
CHART SOURCE: FXCM MARKETSCOPE 2.0
The left chart shows the daily ichimoku of FXCM’s dollar index - USDOLLAR. It is clear that the current trend is down, until proven otherwise.
-
Price is below the cloud.
-
The cloud remains light pink (resistance).
-
Price is below the black base line.
-
The black base line is trending down.
-
The orange lagging line is below price.
-
However, price is likely too far from cloud resistance (blue dashed vertical).
-
This shows a very strong momentum but it is indicative of an oversold market.
-
As such a pullback is expected to relieve technical pressure.
The right chart shows the H1 ichimoku and shows the bounce in the USDOLLAR. This is due to a short-squeeze as the greenback rallies in this time frame. This is not surprising given that July was the weakest month for the USDOLLAR in a decade. Part of the short-squeeze is due to profit taking. However, USDOLLAR weakness is not surprising given the growth in M3 money supply off the back of the unlimited QE programme announced by the Fed in late March. We are looking at the H1 chart with interest for a potential signal that the bounce has ended and the short-term is once again syncing up with longer term downtrend.
Author

Russell Shor (MSTA, CFTe, MFTA) has an Honours Degree in Economics from the University of South Africa and holds the coveted Certified Financial Technician and Master of Financial Technical Analysis qualifications from the Interna


