• Weekly initial jobless claims expected to revert to trend
  • Non-farm payrolls depict strong labor markets
  • Previous week's spike related to government shutdown, now ended

The US Department of Labor will release initial weekly jobless claims at 8:30 am EST, 13:30 GMT on February 7th. 

Forecast

Initial jobless claims are predicted to be 221,000 in the week ending February 1st down from 253,000 in the prior week.  The four week moving average is 220,250 in the current week.

Jobless Claims and the Labor Economy

Initial filings for unemployment claims are one of the earliest and most reliable indicators for the labor market. 

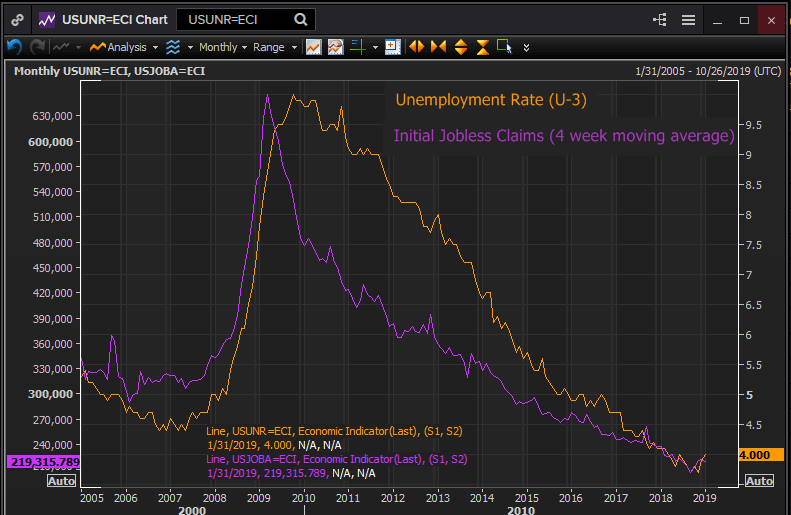
In 2006 initial claims shot up from 289, 000 (4 week moving average) in January to 327,000 in May and stayed elevated until September 2007. In the same period the unemployment rate (U-3) declined from 4.8% to 4.4%.  From June on they moved in tandem. Claims had climbed to 345,000 by year end and the unemployment rate to 5%.

It wasn’t until May 2008 that indications of serious trouble began. Claims soared over the next ten months from 366,000 to their peak at 655,000 in March 2009 and the unemployment rate jumped from 5.4% in May 2008 to 10% in October 2009.

Reuters

Initial Claims in History

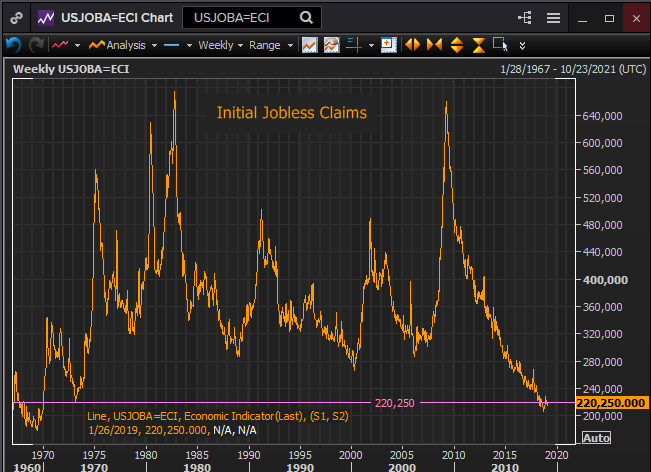
Initial jobless claims are one of the longest running economic series beginning in January 1967.  This turns out to be a necessity when comparing the historical averages. The current four week moving average of 220,250 is a level that the US has not reached in 46 years, since January 1973. It is more impressive when one considers that claims are an absolute number not an index or percentage and that the US population has increased 55% since disco was the rage. In 1973 the population was 211 million. It is now 328 million.

Reuters

Coincident Indicators

Most secondary employment statistics remains at levels congruent with strong employment and by implication low jobless claims.

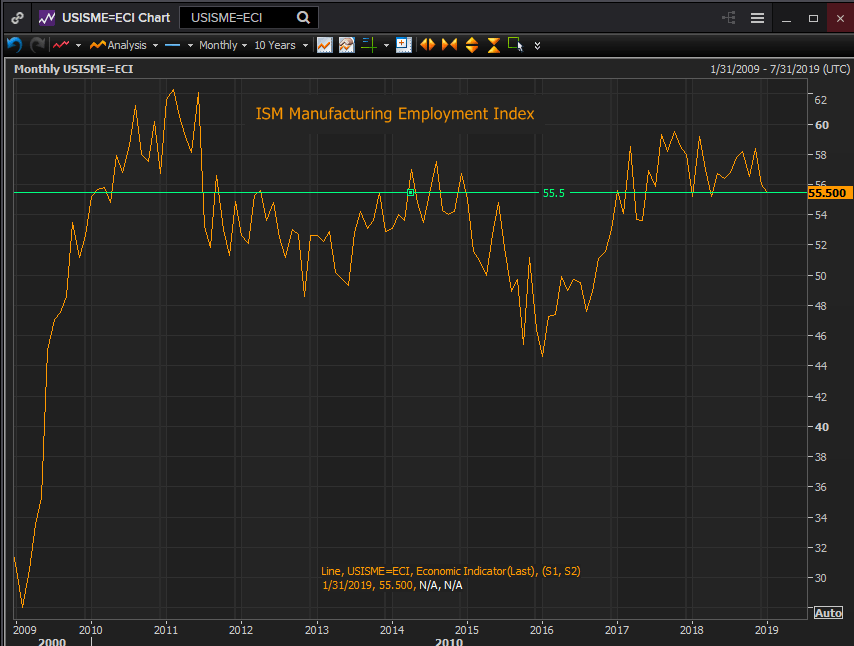
The manufacturing employment index from the Institute for Supply Management for January came in at 55.5 off slightly from 56.0 in December and 58.4 in November. This is at the low end of the range for the past two years but securely in the expansion bracket which divides at 50 between growth and contraction.

Reuters

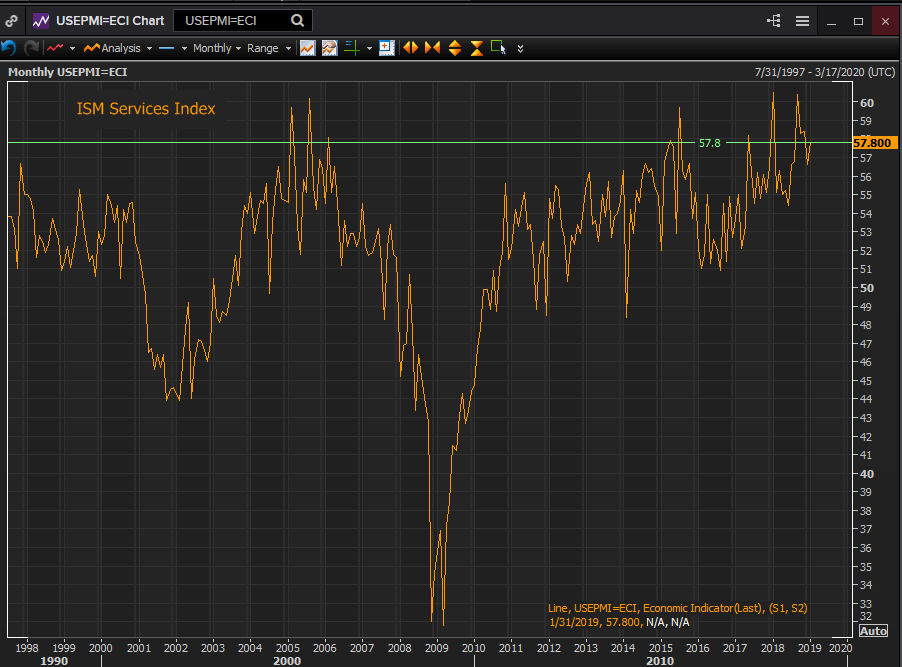
Likewise the ISM services employment index was 57.8 in January up from 56.6 the prior month. September’s 60.4 score was the second highest in the history of the series which extends to July 1997.

Reuters

The Conference Board Consumer Confidence Survey charts labor market outlook among the general population. In January the proportion expecting more jobs in the months ahead dropped to 14.7% from 16.6% in December.  Those anticipating fewer openings increased to 16.5% from 14.6%.  These slight changes are not indicative of a worsening trend.

Because jobless claims are a weekly number, individual weeks bring little information, it is the trend and the average that are important.  Last weeks burst of 253,000 claims is an attribute of the partial government shutdown. The trend remains wholly positive for the labor market.


Information on these pages contains forward-looking statements that involve risks and uncertainties. Markets and instruments profiled on this page are for informational purposes only and should not in any way come across as a recommendation to buy or sell in these assets. You should do your own thorough research before making any investment decisions. FXStreet does not in any way guarantee that this information is free from mistakes, errors, or material misstatements. It also does not guarantee that this information is of a timely nature. Investing in Open Markets involves a great deal of risk, including the loss of all or a portion of your investment, as well as emotional distress. All risks, losses and costs associated with investing, including total loss of principal, are your responsibility. The views and opinions expressed in this article are those of the authors and do not necessarily reflect the official policy or position of FXStreet nor its advertisers. The author will not be held responsible for information that is found at the end of links posted on this page.

If not otherwise explicitly mentioned in the body of the article, at the time of writing, the author has no position in any stock mentioned in this article and no business relationship with any company mentioned. The author has not received compensation for writing this article, other than from FXStreet.

FXStreet and the author do not provide personalized recommendations. The author makes no representations as to the accuracy, completeness, or suitability of this information. FXStreet and the author will not be liable for any errors, omissions or any losses, injuries or damages arising from this information and its display or use. Errors and omissions excepted.

The author and FXStreet are not registered investment advisors and nothing in this article is intended to be investment advice.

Recommended Content


Recommended Content

Editors’ Picks

EUR/USD clings to daily gains above 1.0650

EUR/USD clings to daily gains above 1.0650

EUR/USD gained traction and turned positive on the day above 1.0650. The improvement seen in risk mood following the earlier flight to safety weighs on the US Dollar ahead of the weekend and helps the pair push higher.

EUR/USD News

GBP/USD recovers toward 1.2450 after UK Retail Sales data

GBP/USD recovers toward 1.2450 after UK Retail Sales data

GBP/USD reversed its direction and advanced to the 1.2450 area after touching a fresh multi-month low below 1.2400 in the Asian session. The positive shift seen in risk mood on easing fears over a deepening Iran-Israel conflict supports the pair.

GBP/USD News

Gold holds steady at around $2,380 following earlier spike

Gold holds steady at around $2,380 following earlier spike

Gold stabilized near $2,380 after spiking above $2,400 with the immediate reaction to reports of Israel striking Iran. Meanwhile, the pullback seen in the US Treasury bond yields helps XAU/USD hold its ground.

Gold News

Bitcoin Weekly Forecast: BTC post-halving rally could be partially priced in Premium

Bitcoin Weekly Forecast: BTC post-halving rally could be partially priced in

Bitcoin price shows no signs of directional bias while it holds above  $60,000. The fourth BTC halving is partially priced in, according to Deutsche Bank’s research. 

Read more

Week ahead – US GDP and BoJ decision on top of next week’s agenda

Week ahead – US GDP and BoJ decision on top of next week’s agenda

US GDP, core PCE and PMIs the next tests for the Dollar. Investors await BoJ for guidance about next rate hike. EU and UK PMIs, as well as Australian CPIs also on tap.

Read more

Majors

Cryptocurrencies

Signatures