US October CPI Preview: US Dollar to weaken on a CPI-inspired risk rally
- Annual Consumer Price Index (CPI) is forecast to decline to 8% in October.
- Federal Reserve hinted at the possibility of a smaller rate hike in December.
- US Dollar is likely to face additional selling pressure if CPI figures match expectations.

Inflation in the United States, as measured by the Consumer Price Index (CPI), is expected to edge lower to 8% in October from 8.2% in September. The Core CPI, which excludes volatile food and energy prices, is forecast to retreat to 6.5% on a yearly basis from 6.6%.
One of the primary indicators as well as a sizable component of rising inflation in the US is used car prices. These have witnessed a sharp increase since the mid 2021s. The latest data published by Manheim showed earlier in the month that used vehicle prices dropped by 2.2% in October, resulting in a 10.6% decline from a year ago. This development by itself could indicate inflation softened in October. House rental prices, which have a 33% weight in CPI compared to 9.2% for used and motor vehicles, however, continue to rise at a steady pace. Hence, a significant fall in inflation or core inflation seems unlikely in October.
Market implications
The US Dollar (USD) has been struggling to gather strength since the beginning of the week despite the upbeat October jobs report and the US Federal Reserve’s hawkish policy outlook.
In the monetary policy statement published after the November meeting, the US central bank noted that policymakers will take cumulative tightening, policy lags and financial developments into account when determining the pace of rate hikes. Although this statement hinted at the possibility that the Fed may have reached its peak hawkishness, FOMC Chairman Jerome Powel reaffirmed the aggressive tightening stance. Powell said that he expected the terminal rate projection to be revised higher in December’s Summary of Economic Projections and explained that reaching the upper limit and keeping rates there was now more important than the speed of rate increases.
The USD managed to outperform its rivals following the Fed event but it came under heavy selling pressure on Friday. The US Bureau of Labor Statistics announced that Nonfarm Payrolls rose by 261,000 in October. This reading surpassed analysts’ estimate of 200,000 by a wide margin but failed to provide a boost to the USD as the underlying details of the report revealed that annual wage inflation declined to 4.7% from 5%.
The market reaction to the October labor market data suggests that investors are unlikely to seek refuge in the USD as long as CPI prints arrive near or below expectations. The CME Group FedWatch Tool shows that the probability of a 50 basis points FOMC rate hike in December currently stands at 54.4%, up from 51.5% on Fed day last week.
With the annual core inflation reading of 6.5% or lower, an increase in the probability of a smaller rate increase in December is likely to rise. In that scenario, another bout of risk appetite could hurt the US Dollar and open the door to a rally in Wall Street.
On the other hand, an unexpected rise in either the headline annual CPI or the Core CPI is likely to remind investors of the Fed’s commitment to battle inflation and hurt the risk-sensitive assets while providing a boost to the US Dollar.
US Dollar Index Technical Outlook
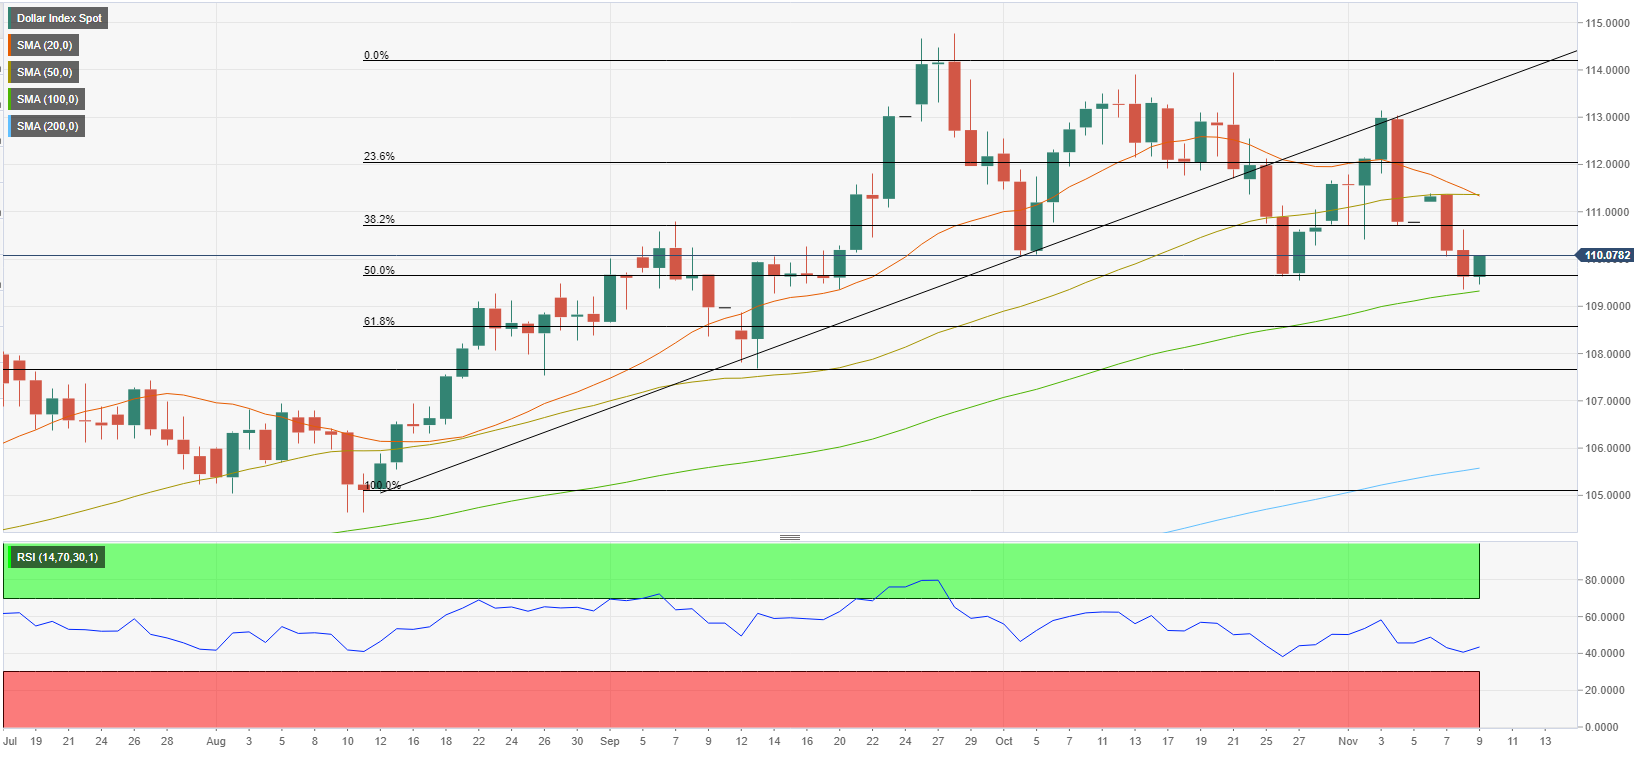
After breaking below the ascending trend line coming from mid-August in late October, the US Dollar Index failed to return above that level. Additionally, the Relative Strength Index (RSI) indicator on the daily chart stays below 50, pointing to a bearish bias in the short term.
The index stays within a touching distance of the 100-day Simple Moving Average (SMA), which is currently located at 109.50. The Fibonacci 50% retracement of the latest uptrend reinforces that level as support as well. With a daily close below 109.50, the index could extend its slide toward 108.50 (Fibonacci 61.8% retracement) and 107.70 (September 13 low).
On the upside, the index faces interim resistance at 110.70 (Fibonacci 38.2% retracement) ahead of 111.40 (20-day SMA, 50-day SMA) and 112.00 (Fibonacci 23.6% retracement, psychological level).
Premium
You have reached your limit of 3 free articles for this month.
Start your subscription and get access to all our original articles.
Author

Eren Sengezer
FXStreet
As an economist at heart, Eren Sengezer specializes in the assessment of the short-term and long-term impacts of macroeconomic data, central bank policies and political developments on financial assets.


