US May Retail Sales Preview: Analyzing major pairs' reaction to previous releases
- Retail Sales in the US is expected to contract modestly in May.
- Correlation analysis does not reveal a strong relationship between initial market reaction and deviation.
- USD/JPY has a strong negative correlation with sales data surprises four hours after the release.

The US Census Bureau will release the May Retail Sales report on Tuesday, June 15. After staying unchanged at $619.9 billion in April, Retail Sales are expected to decline by 0.4% on a monthly basis.
The general market view is that a positive surprise in the Retail Sales reading is likely to provide a boost to the greenback and vice versa. In order to understand how impactful this data is on the USD’s performance against its rivals, we analyzed the market reaction of four major pairs, EUR/USD, GBP/USD, USD/JPY and AUD/USD, to the previous 11 Retail Sales prints.
Methodology
The FXStreet Economic Calendar assigns a deviation point to each macroeconomic data release to show how big the divergence was between the actual print and the market consensus. Although Retail Sales were unchanged in April, the deviation was -0.37 because analysts were expecting a 1% increase.
Like this article? Help us with some feedback by answering this survey:
On the flip side, the 7.6% increase recorded in January against analysts’ estimate of 1.1% was a relatively big positive surprise with the deviation posting 5.82 for that particular release.

“Deviation: It measures the surprise caused when the Actual data differs from the Consensus. It can oscillate in an open scale, usually between -7 and +7.”
Next, we plotted the reaction, in terms of pips, of the major pairs mentioned above 15 minutes, one hour and four hours after the release to see if the general market view held.
Finally, we calculated the correlation coefficient (r) to figure out which major pair had the strongest correlation at which time frame. When r approaches -1, it suggests there is a significant inverse correlation, while a significant positive correlation is identified when r moves toward 1.
Results
There were seven negative surprises and four positive surprises in the previous 11 releases. On average, the deviation was -0.52 on disappointing prints and 2.08 on upbeat figures. 15 minutes after a negative surprise, the average gains in EUR/USD and GBP/USD were 1.4, 3.5 pips, respectively, while USD/JPY and AUD/USD lost 3.5 pips and 0.4 pips, respectively. On the other hand, EUR/USD and USD/JPY lost 3.2 and 1.2 pips, respectively, on average following positive surprises while GBP/USD and AUD/USD gained 0.75 and 0.25 pips, respectively. This finding suggests that the initial market reaction to Retail Sales data is largely muted.
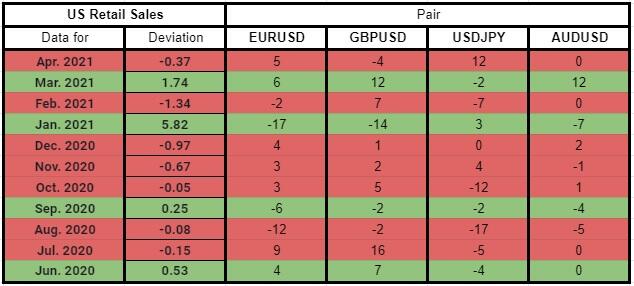
15-min deviation table
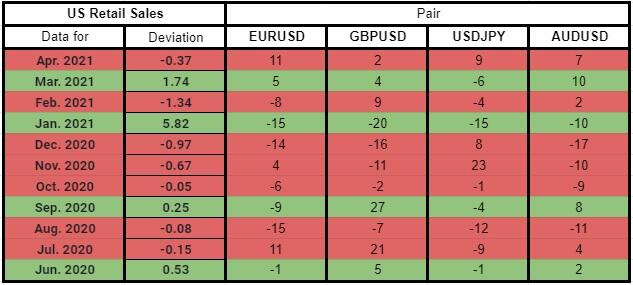
60-min deviation table

240-min deviation table
EUR/USD
EUR/USD has a correlation coefficient of -0.57, -0.24 and -0.01 15 minutes, 60 minutes and 240 minutes after the release, respectively. These numbers suggest that the inverse correlation between the Retail Sales deviation and EUR/USD action is virtually non-existent one hour and four hours after the release. Although the initial reaction is somewhat correlated, the average pip-change is too small to consider it as a trading opportunity.


GBP/USD
GBP/USD has a correlation coefficient of -0.50, -0.34 and -0.18 15 minutes, 60 minutes and 240 minutes after the release, respectively. Similar to EUR/USD, the inverse correlation of the GBP/USD pip-change with the Retail Sales deviation weakens gradually and fades away four hours after the release.


USD/JPY
USD/JPY has a correlation coefficient of 0.18, -0.52 and -0.70 15 minutes, 60 minutes and 240 minutes after the release, respectively. The pair’s initial reaction to Retail Sales data is largely unpredictable. However, the correlation turns inverse one hour after the release and becomes significant by the fourth hour. This finding suggests that if Retail Sales print is better than expected, USD/JPY falls and vice versa.


AUD/USD
AUD/USD has a correlation coefficient of -0.2, -0.04 and 0.003 15 minutes, 60 minutes and 240 minutes after the release, respectively, making it the least correlated pair, out of the four tested, with US Retail Sales surprises.


Summary
When there is a negative or a positive surprise in US Retail Sales data, the initial market reaction is insignificant. There is no clear relationship between the movements of EUR/USD, GBP/USD and AUD/USD pairs and the deviation one hour and four hours after the release. This could be due to the fact that Retail Sales is impacted by temporary factors, such as weather conditions and holiday seasons, making it an unreliable leading indicator.
The most interesting finding is the strong inverse correlation with USD/JPY and Retail Sales deviation four hours after the release. Nevertheless, the average pip-change on that time frame is 5.5 and -6.7pips on a negative and positive deviation, respectively, not providing enough room for a trading opportunity.
Like this article? Help us with some feedback by answering this survey:
Author

Eren Sengezer
FXStreet
As an economist at heart, Eren Sengezer specializes in the assessment of the short-term and long-term impacts of macroeconomic data, central bank policies and political developments on financial assets.

















