US June CPI Preview: Dollar rally could lose steam on soft inflation data
- Annual CPI in the US is forecast to rise to 8.8% in June.
- Markets are not sure about the size of the Fed's September rate hike.
- Core inflation is set to edge lower on falling crude oil prices.
The relentless US dollar rally extends further ahead of the highly-anticipated inflation data from the US. The US Dollar Index (DXY), which tracks the greenback’s performance against a basket of six major currencies, is already up more than 3% in July amid growing fears of the global economy tipping into recession.
The US Bureau of Labor Statistics is expected to report that the Consumer Price Index (CPI) rose to a fresh multi-decade high of 8.8% on a yearly basis in June from 8.6% in May. The Core CPI, which excludes volatile food and energy prices, is forecast to decline to 5.8% from 6%. Crude oil prices fell sharply in June, suggesting that it wouldn’t be surprising to see a retreat in core inflation. After having posted gains for six straight months, the barrel of West Texas Intermediate (WTI) lost more than 8% in June.
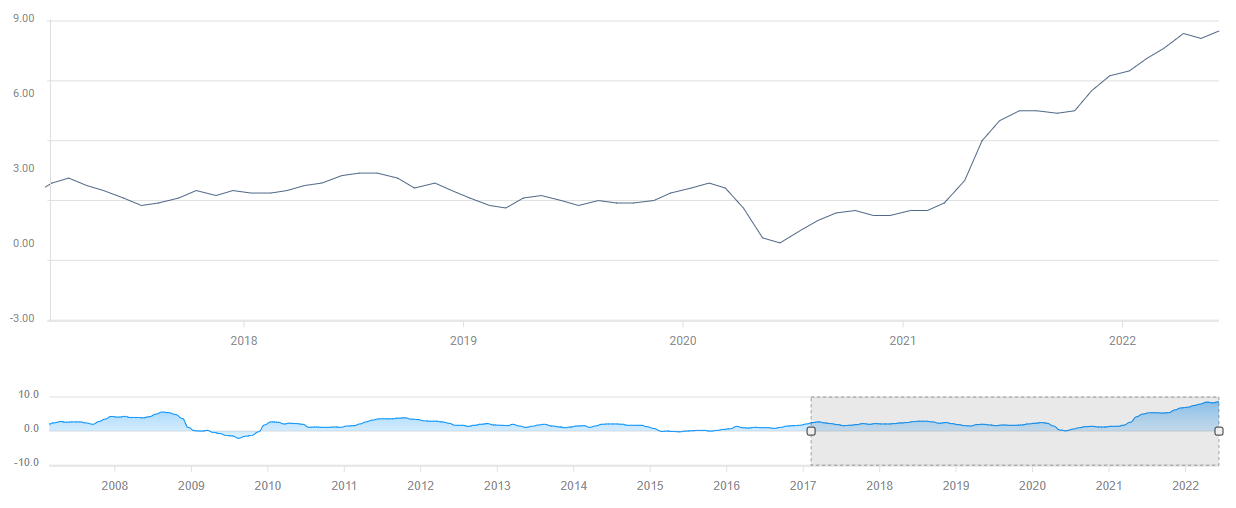
US annual CPI chart
Market implications
The US dollar remains the go-to safe-haven asset as the US Federal Reserve remains on track to continue to tighten its policy with the US economy remaining relatively healthy. The US central bank is widely expected to hike its policy rate by 75 basis points (bps) in July and several FOMC policymakers, including Chairman Jerome Powell, voiced their willingness to do so. Investors, however, are not certain about the size of the September rate increase.
After the monthly jobs report showed that Nonfarm Payrolls in the US rose more than expected in June, the probability of one more 75 bps hike in July jumped to 30% from 15%, according to the CME Group’s FedWatch Tool. Hence, a hot inflation report could trigger a similar reaction and help the dollar preserve its strength against its rivals.
On the other hand, an annual CPI print in line with the market consensus could cause a “buy the rumor, sell the fact” market action. White House Press Secretary Karine Jean-Pierre told reporters on Monday that she expects new CPI data to be “highly elevated.” Additionally, the Relative Strength Index (RSI) indicator on the daily DXY chart holds above 70, suggesting the index is overbought and that it could stage a technical correction before continuing its rally. The last time when the daily RSI climbed above 70 in late April, DXY lost more than 1% before resuming its uptrend. Unless CPI figures surpass analysts’ estimates, investors could take the opportunity to book their profits and cause the dollar to weaken.
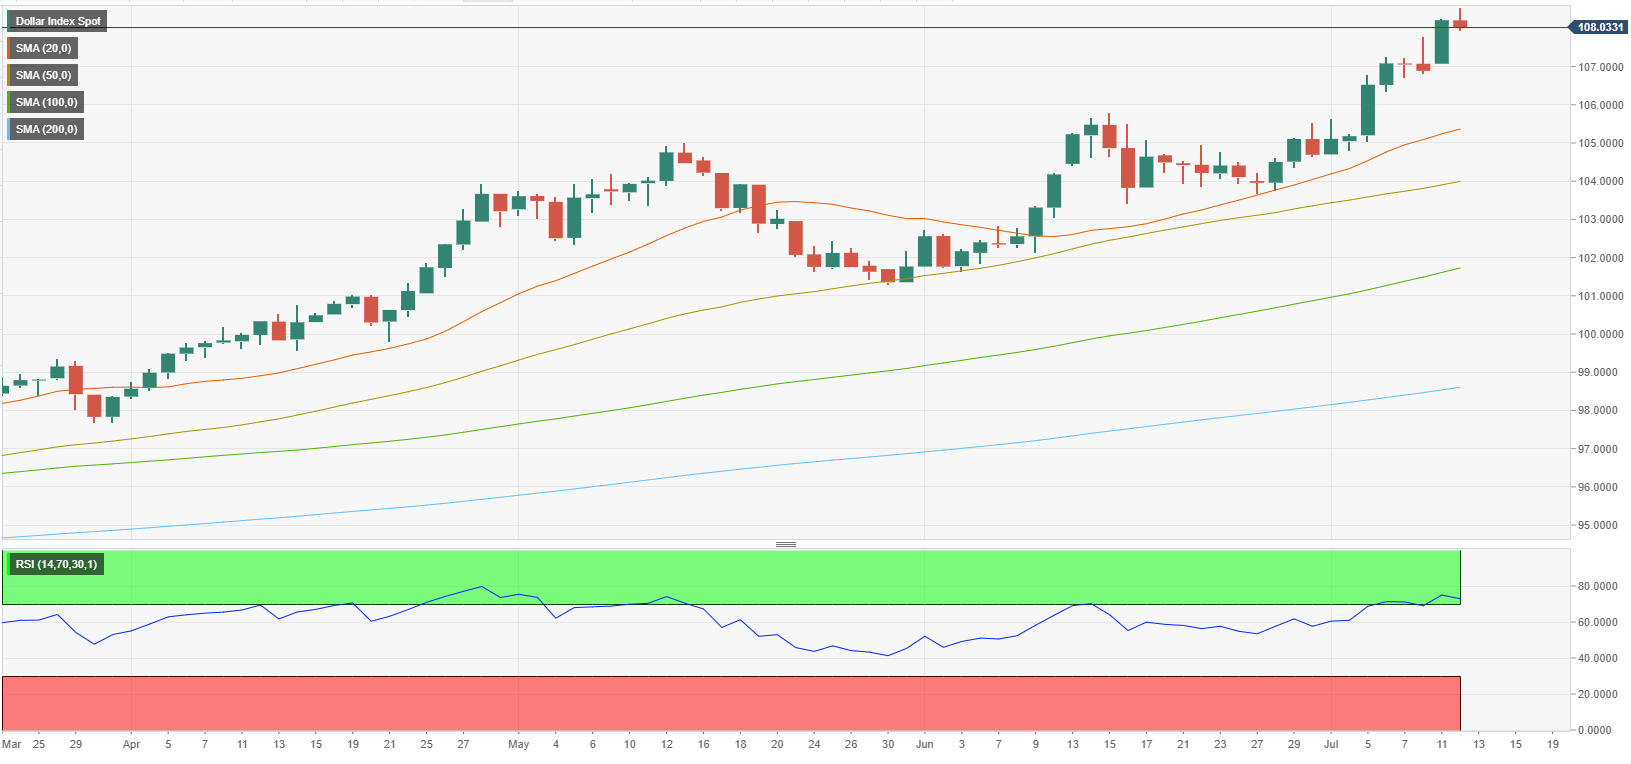
DXY daily chart
An unexpected decline in annual CPI could cause market participants to reassess the Fed’s rate outlook and open the door for a USD selloff. Furthermore, a lower-than-expected print could also have a positive impact on market mood and cause the bearish pressure on the greenback to increase. With the Fed going into its blackout period on July 16, investors might refrain from betting on further dollar strength, and DXY could stay in a consolidation phase until the Fed’s policy announcements on July 27.
Premium
You have reached your limit of 3 free articles for this month.
Start your subscription and get access to all our original articles.
Author

Eren Sengezer
FXStreet
As an economist at heart, Eren Sengezer specializes in the assessment of the short-term and long-term impacts of macroeconomic data, central bank policies and political developments on financial assets.


