US July CPI Preview: What is the base effect and why it matters
- Annual CPI in the US is forecast to edge lower to 8.7% in July.
- The base effect could be misleading when assessing inflation data.
- Markets are pricing in a nearly-70% chance of a 75 bps Fed rate hike in September.

Inflation in the United States, as measured by the Consumer Price Index (CPI), is expected to decline to 8.7% on a yearly basis in July from 9.1% in June. The US Federal Reserve remains committed to continuing to tighten its policy rate to battle inflation and CPI figures could significantly impact the way markets price in the September rate decision.
According to the CME Group’s FedWatch Tool, there is now a 69.5% probability of the Fed opting for a 75 basis points (bps) hike at its next meeting, leaving room for further dollar strength on a strong CPI reading for July. What if the annual CPI were to fall to 8.8% in July? Would markets see that as a sign that price pressures are starting to ease?
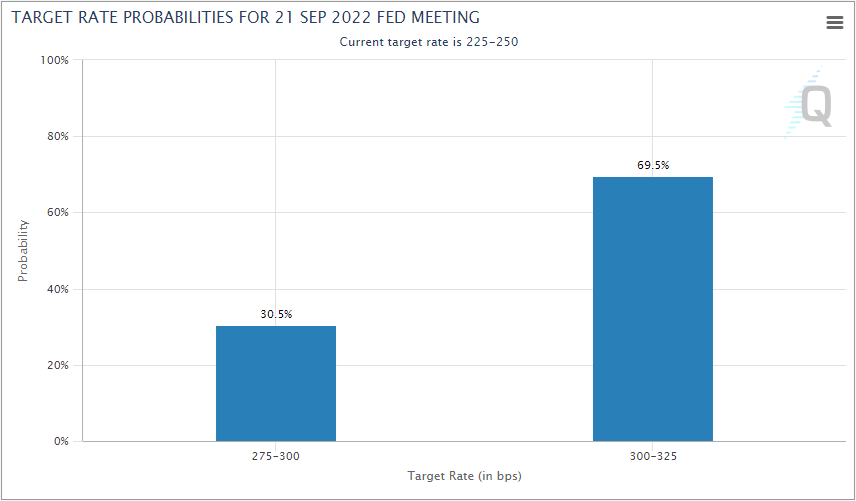
Source: CME Group FedWatch Tool
The base effect
Let’s assume that you paid $100 for an item in January 2021 and the price went up to $105 in February due to an unusual circumstance before reaching $110 in January 2022. In that case, annual inflation was 10% in January 2022. Now, if the price were to rise to $115 in February 2022, the annual inflation would come down to 9.5% for that period (reflecting the increase from $105 and $115). That doesn’t mean price pressures are softening. In fact, the $5 monthly increase in February 2022 is quite significant considering that the price rose by a total of $10 in the previous 12 months. However, because there was a big jump in the base number - February 2021 in that case - that is used to calculate the annual figure, the final outcome is lower than what it was in January.
How is annual CPI inflation calculated?
The Bureau of Labor Statistics (BLS) comes up with a final CPI figure each month after having conducted its Consumer Expenditure Survey. It compares this CPI value to the previous month and the previous year to find the percentage changes.
In the table below, CPI values in February 2021 and 2022 were 263.014 and 283.716, respectively. Hence, annual CPI inflation was 7.9% ((283.716 - 263.014) * 100 / 263.014).
Let’s take a look at the CPI value for April 2021. It rose to 267.054 from 264.877 in March. In 2022, the CPI value climbed to 289.109 in April from 287.504 in March. Despite that increase, the annual inflation in April 2022 declined to 8.3% from 8.5%. That is how the base effect could distort the data and be misleading at times. Although there still was a considerable increase in prices from March to April in 2022, it was at a relatively softer rate than it was a year ago, translating into a drop in annual inflation.
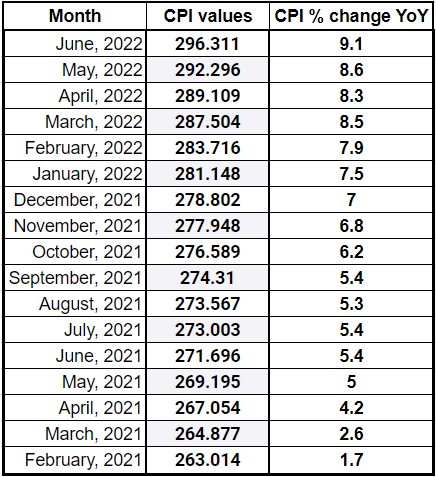
For annual CPI to decline to 8.7% in July from 9.1% in June, the CPI value would need to rise slightly to 296.754 from 296.311 in June. Going back to the question we asked at the beginning of the article, the CPI value would need to rise to 297.027 for the July annual CPI to arrive at 8.8%.
To summarize, a CPI print of 8.7% in July would suggest that inflation may have peaked in June. A reading of 8.8%, however, would show that prices continued to rise in July, regardless of the decline in the annual inflation rate.
It’s worth noting that investors will also pay close attention to the Core CPI figure, which excludes volatile food and energy prices.
Nevertheless, a modest decline in the annual CPI might not be enough to cause investors to scale down their hawkish bets. Markets will look for a yearly inflation rate of below 8.7% or moderation in core inflation to scale down hawkish Fed bets, especially after the impressive July jobs report.
Premium
You have reached your limit of 3 free articles for this month.
Start your subscription and get access to all our original articles.
Author

Eren Sengezer
FXStreet
As an economist at heart, Eren Sengezer specializes in the assessment of the short-term and long-term impacts of macroeconomic data, central bank policies and political developments on financial assets.


